Carbon pricing is poised to be the backbone of Canada’s efforts to achieve its 2030 greenhouse gas emissions target on the way to net zero by 2050. And that’s good news, because carbon pricing is a cost-effective way to reduce emissions.
But here’s the thing: carbon pricing only works if systems are designed well.
Over the last five months, we independently assessed the effectiveness of federal, provincial, and territorial carbon pricing systems. We found much to admire, as provinces and territories have tailored carbon pricing according to their context and their own priorities. But we also found some design issues that should be addressed to deliver fair, cost-effective emissions reductions.
This blog provides an overview of our findings. It presents three maps that illustrate the differences in carbon pricing design choices across the country, comparing three key indicators.
Map 1: Comparing coverage
In general, broader coverage of carbon pricing systems is better. Covering more emissions means that carbon pricing creates incentives for more emitters to find ways to avoid producing those emissions. And consistently applying a price across a broader set of emissions also lowers the costs of achieving targets by making sure all “low-hanging fruit” gets harvested.
Two factors make comparing covered emissions across systems more complicated.
First, not all emissions are easy to price. It’s easy to quantify emissions produced by burning fossil fuels. And large emitters also already measure emissions produced from other processes—for example, chemical processes in cement manufacturing. But it’s hard to quantify emissions from other, small and widely distributed sources such as those from agricultural lands and farm animals.
Second, some systems deliberately exempt some emission sources. These exemptions may be rooted in efforts to shelter some emitters. They may be legitimate, but make no mistake, they mute the price signal and undermine effectiveness.
To address these two factors, and to compare program coverage across jurisdictions on a consistent basis, we developed a standardized coverage indicator that counts only emissions that are covered in at least one Canadian carbon pricing system. This approach controls for some jurisdictions having a large share of emissions sources that are not covered by carbon pricing anywhere in Canada, while highlighting emissions sources that have been excluded from the price.
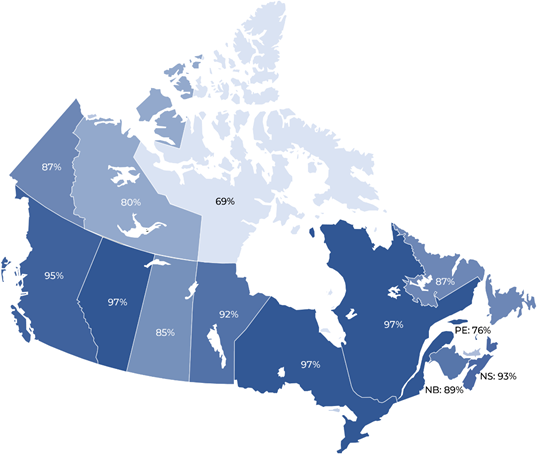
Map 1, below, compares the standardized coverage across all provinces and territories.
No jurisdiction covers all possible “coverable” emission sources, with coverage varying from 69 per cent to 97 per cent. We found multiple emissions sources that are covered in some, but not all, carbon pricing programs. These exemptions and uneven coverage limit the impacts of the price signal.
Map 1: Comparing Covered Emissions in 2020
Map 2: Comparing marginal cost
A second indicator is the “marginal” cost of carbon emissions—the value of an emissions reduction, with a higher value creating a higher incentive to reduce emissions. The marginal cost is essentially the price of carbon. The marginal price signal creates incentives for low-carbon technology or behaviour change, thereby lowering the emission intensity of production or consumption.
Again, however, the story is more complicated. Importantly, the price of carbon is not the sole determinant of effectiveness, especially in cap-and-trade systems such as those in Quebec and Nova Scotia. Prices of allowances in cap-and-trade systems will not fully reflect the ambition of emissions “caps” if either: 1) the system allows for permit trade with other jurisdictions; or 2) other, non-pricing policies are driving significant emissions reductions alongside the cap-and-trade system.
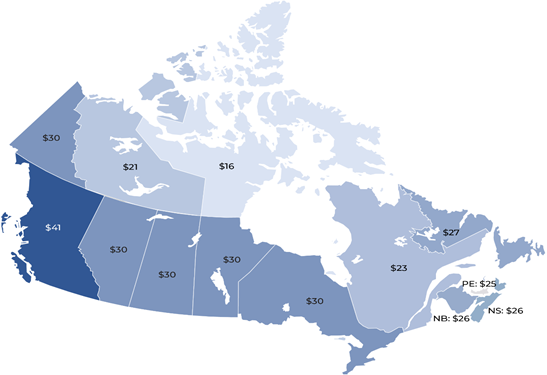
Map 2 compares marginal carbon costs, which ranges from $16 to $41 per tonne.
Map 2: Comparing Marginal Cost Incentives in 2020
Several factors explain why prices are not uniform across the country:
- Quebec’s carbon price is tied to the market price of allowances in the Western Climate Initiative (WCI) through link trade with California. Quebec’s aggressive cap means that this lower carbon price should not be interpreted as a weak price signal. We also note Quebec is the only jurisdiction in Canada with a long-term price signal to 2030.
- British Columbia has the highest marginal cost incentive. The increased marginal cost incentive provided by the CleanBC Industrial Incentive Program increases the effective price since facilities have an incentive beyond the carbon tax rate to reduce emissions relative to their greenhouse gas intensity.
- Alberta, Ontario, New Brunswick, Manitoba, Newfoundland and Labrador, Prince Edward Island, Yukon, Saskatchewan, and the Northwest Territories all have marginal cost incentives aligned with the federal carbon price schedule. Absent modelling of credit supply and demand, we assume that the price holds in the large-emitter programs, though there are legitimate concerns that over-allocation could undermine demand for credits, and thus reduce the actual carbon price faced by firms.
- Newfoundland and Labrador, New Brunswick, and Prince Edward Island all offer point-of-sale rebates, limiting the overall increase of some fuel prices tied to the carbon price. New Brunswick has recently indicated it will eliminate this design choice, instead using revenue to reduce existing taxes.
- The Northwest Territories and Nunavut provide a range of direct rebates to mute the income impact on business and households, including those in remote communities.
Two risks emerge when not all policies have the same price. First, lower carbon prices in some jurisdictions undermine overall effectiveness. Second, uneven carbon prices undermine cost-effectiveness, since lower-cost emissions reductions will go unrealized in some jurisdictions.
The solution is straightforward: point-of-sale rebates that are tied to fuel consumption should be removed. Affordability concerns can and should be addressed in other ways not tied to fuel consumption, such as rebating directly to households or providing abatement subsidies, as many carbon pricing programs in Canada are doing.
Map 3: Comparing average cost
Finally, a third indicator is the average cost of carbon. The average cost is the total cost paid for all compliance divided by tonnes covered. It affects long-term effectiveness by driving capital decision making related to the costs of ownership and promotes major facility retrofits such as installing carbon capture utilization and storage technology.
Average costs have more complex implications than marginal costs or covered emissions. On the one hand, governments have deliberately designed systems to have lower average costs—while maintaining higher marginal costs—to create incentives for companies to reduce emissions by improving performance, not by shifting investment and production to other jurisdictions. On the other hand, a low average cost mutes the incentive to make the long-term, transformative shifts in the Canadian economy needed for Canada to compete in a carbon constrained world.
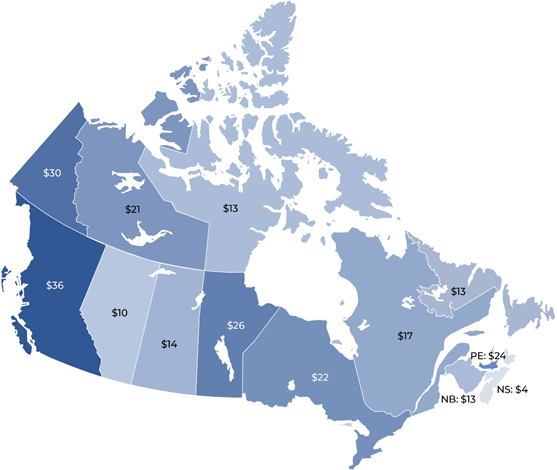
Map 3 indicates that the average cost of programs ranges from a low of $4 per tonne to a high of $36 per tonne, with a national average of $17 per tonne:
- The major outlier is Nova Scotia, at $4 for all covered emissions, where freely granted emissions credits result in compliance tonnes representing just 13.5 per cent of covered tonnes.
- Alberta is also low at $10 for all covered emissions. Alberta and Saskatchewan ($14) have a lower average cost because large emitters make up a larger share of each jurisdiction’s total emissions. Also, fewer emissions in the large emitter sectors are priced, given concerns related to competitiveness.
- Newfoundland and Labrador’s average cost, at about half the marginal cost, is a function of only 10 per cent of covered emissions subject to compliance in the large emitter program, but also some point-of-sale rebates to fuel consumers. As well, the large emitter sectors make up a significant share of total covered emissions (57 per cent).
- Quebec’s low average cost is a function of free allocation for the large emitter sectors as well as the low marginal cost incentive that reflects the market price for WCI allowances.
Map 3: Average Carbon Cost for All Covered Emissions in 2020
The observed differences in the average cost present a few risks. First, the impact on businesses and household income is higher in some jurisdictions over others, raising fairness concerns. Second, the differing average costs across businesses, including large emitters, means that Canada has a domestic competitiveness issue. Finally, as mentioned above, low average costs dilute incentives for more fundamental transformations of Canada’s economy in the long term, especially as other countries move toward aggressive climate policy, levelling the international playing field.
Over time, Canadian jurisdictions should work together to better align and then increase large emitter average costs to be more consistent across both jurisdictions and sectors.
What’s next for carbon pricing in Canada?
Carbon pricing is now a key element of Canada’s collective efforts to decarbonize. Over the last five years, carbon pricing has moved from covering 38 per cent of our national emissions to 78 per cent. But as the systems mature and the global policy landscape evolves, Canada must improve the integrity of its carbon pricing systems. Regional variations across the federation can and should be accommodated, but only if they do not undermine the effectiveness of pan-Canadian carbon pricing, overall.
It’s time for federal, provincial and territorial governments to build on the existing foundation and make carbon pricing more consistent, transparent and effective.
For our recommendations of what governments can do to tune-up carbon pricing, check out our summary report.