1. Introduction
In a warming climate, Canadian cities are at risk of increasingly severe and frequent floods. Nearly 80 per cent of Canadian cities are built on floodplains, exposing populations, property, and infrastructure to flood risk (Golnaraghi et al., 2020; Jakob et al., 2015). The socioeconomic impacts of urban flooding are expected to worsen in the future because of population growth, expanding developments in flood-prone areas, and more frequent and severe extreme weather linked to climate change (Burn et al., 2016; Honegger & Oehy, 2016; Zhang et al., 2019).
Urban flood risk is the product of three interacting variables: the flood hazard, the exposure of people and assets, and the vulnerability of people and assets to flood impacts (Agrawal et al., 2014; Armenakis et al., 2017; L. Chakraborty, 2021). Most Canadian studies measure the extent and severity of flood hazards, along with the associated exposure of people, property, and infrastructure, but they often fail to include socioeconomic vulnerability. In the context of flooding, socioeconomic vulnerability refers to characteristics of a person or group that influence their capacity to prepare for, respond to, and recover from a flood hazard event (Cutter, 1996; Cutter et al., 2003; Wisner et al., 2004).
Studies from other countries indicate that socially vulnerable communities are disproportionately exposed to flooding and are more significantly affected by its impacts, but there has been little such analysis in Canada (J. Chakraborty et al., 2019; Collins et al., 2019). Spatial assessment of socioeconomic vulnerability is fundamental for identifying local flood risks (Cutter et al., 2013; Guillard-Goncąlves et al., 2015) and would build on existing data about flood hazards to assess the extent to which property and populations are exposed. Measuring the distribution of socioeconomic vulnerability in a community is critical for prioritizing scarce resources to protect those most at risk.
Methods for measuring socioeconomic vulnerability to flood risk in Canada are in their infancy. For this reason, a case study such as this one, which seeks to validate methods, identify data gaps, and draw out potential implications for public policy, can help to advance our understanding. Windsor, Ontario, was identified as a suitable focus due to its considerable exposure to flood risk. The results reveal hotspots of flood risk across neighbourhoods that have both a high concentration of socially vulnerable groups and a high exposure to flooding. We also consider potential policy interventions to address this geographically concentrated flood risk, with a focus on socioeconomic vulnerability.
Study objectives
- Understand the validity of data on socioeconomic vulnerability for measuring flood risk;
- Generate knowledge about the spatial extent and geographic distribution of flood risk across a large urban centre, and assess whether vulnerable communities are disproportionately exposed to flooding; and,
- Consider policy recommendations to address urban flood risk in ways that particularly protect the most vulnerable.
2. Methodology
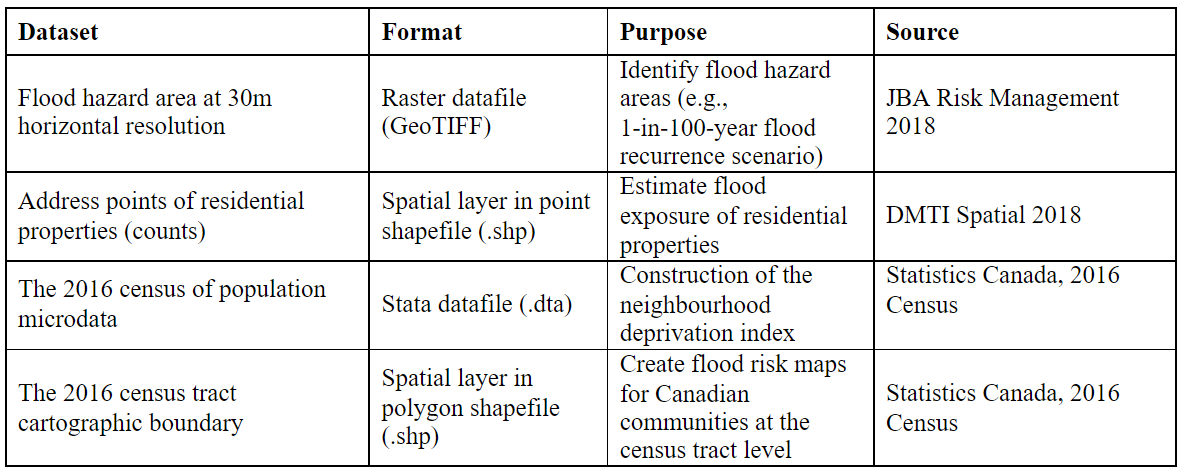
This case study includes geospatial and quantitative analysis using national maps and datasets of flood hazards, residential properties, and census information (Table 1). The study area is the Census Metropolitan Area (CMA) of Windsor, Ontario, Canada, and the unit of analysis is at the census tract level.1 Flood hazard extents were generated using JBA Risk Management’s 2018 Canada Flood Map, which quantifies fluvial (river-related) and pluvial (rain-related) flood risks at a 30-metre horizontal resolution.2 The 100-year recurrence interval—a flood the magnitude of which has a one per cent chance of occurring in any given year—was used as the hazard scenario (Holmes & Dinicola, 2010).
The number of residential properties in the flood hazard area was determined through GIS-based spatial analysis of a 2018 national dataset of address points generated by DMTI Spatial Inc. The socioeconomic vulnerability of exposed populations at these address points was calculated using Statistics Canada census data for socioeconomic, racial/ethnic, and demographic variables. These data were organized using principal component analysis3 to construct a neighbourhood deprivation index that displayed variation in socioeconomic vulnerability across the community. The maps of residential flood exposure and socioeconomic vulnerability were combined to reveal the geographic concentration of flood risk across the CMA. Finally, a bivariate correlation analysis was performed to investigate whether socially vulnerable groups were significantly exposed to flood risk.
Table 1. Datasets
2.1 Study area
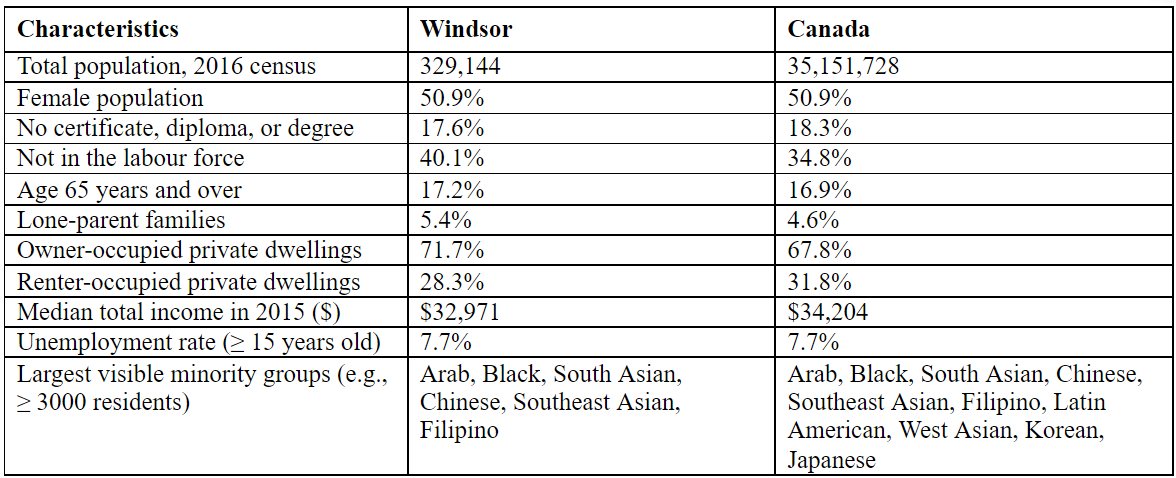
The population of the Windsor CMA includes the City of Windsor and the Towns of Amherstburg, LaSalle, Lakeshore, and Tecumseh. Between 2011 and 2016, the CMA population grew by 3.1 per cent, from 319,246 to 329,144. Windsor CMA is the 16th largest metropolitan area in Canada, larger than Saskatoon, Regina, Sherbrooke, St. John’s, and Barrie, but smaller than Victoria, Oshawa, Halifax, St. Catharines-Niagara, and London (City of Windsor, 2018, 2021). Windsor’s socio-demographic profile, key aspects of which are summarized in Table 2, is reasonably typical for a city of its size in Canada.
Table 2. Key Socio-Demographic Characteristics – Windsor CMA 4
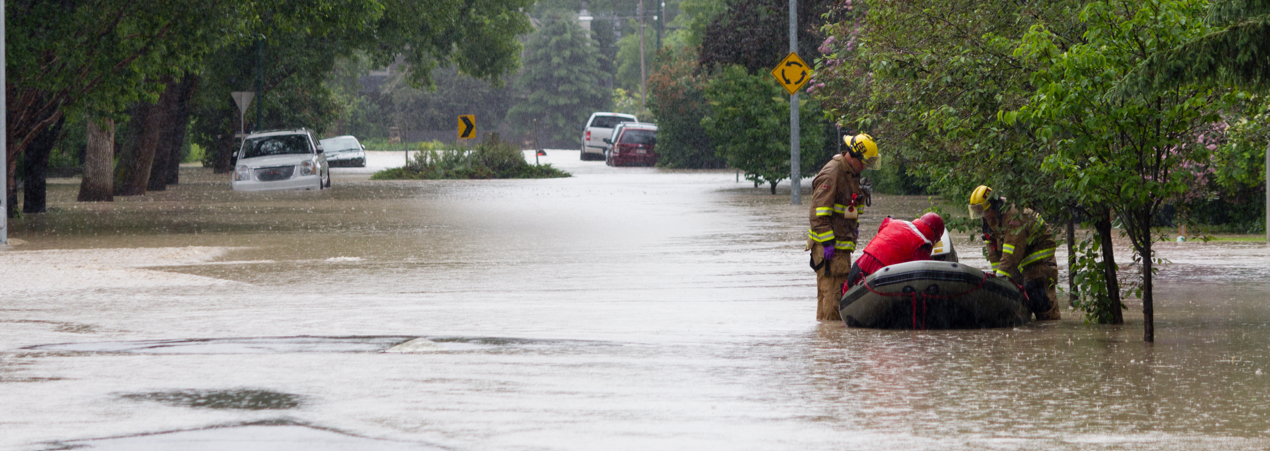
Windsor is located in a low-lying area surrounded by Lake St. Clair and the Detroit River. Flooding has been a consistent problem for the city, with significant events in 2016, 2017, and 2020 (Battagello, 2020; Canadian Underwriter, 2017; CBC News, 2017). An extreme rain event in 2017, for instance, led to flooding in over 6,000 basements and caused $165 million in insured losses (Insurance Bureau of Canada, 2019). In response, the City of Windsor initiated a Sewer and Coastal Flood Protection Master Plan designed to assess and improve its flood mitigation strategies (CBC News, 2020). Given its exposure to flood risk and recent efforts to improve flood mitigation, Windsor is an ideal case for studying the value and implications of socioeconomic vulnerability analysis.
3. Findings and discussion
3.1 Flood exposure of residential properties
Established methods were used to determine flood exposure in three phases (Qiang, 2019). First, the number of residential properties was calculated for each dissemination block.5 Dissemination blocks were used for the property count because they are the smallest geographic units and they cover the entire Canadian territory, which comprises 489,676 dissemination blocks that have unique identifiers and attributes (Statistics Canada, 2018). Second, the total number of dissemination-block-level residential properties was aggregated to find the totals at the census tract level. Finally, the percentage of residential properties exposed to flood hazards in each census tract was calculated using the following equation:

JBA’s flood hazard datasets were imported into ArcMap 10.7.1 to visualize flood-prone areas identified in the Canada Flood Map (Figure 1). Address points were layered onto the flood hazard map using DMTI’s residential address database (DMTI Spatial Inc., 2018).6
Figure 1. Fluvial and Pluvial Flood Hazard Exposure in Windsor CMA
| (a) Residential properties without flooding | (b) Flood hazard exposure |
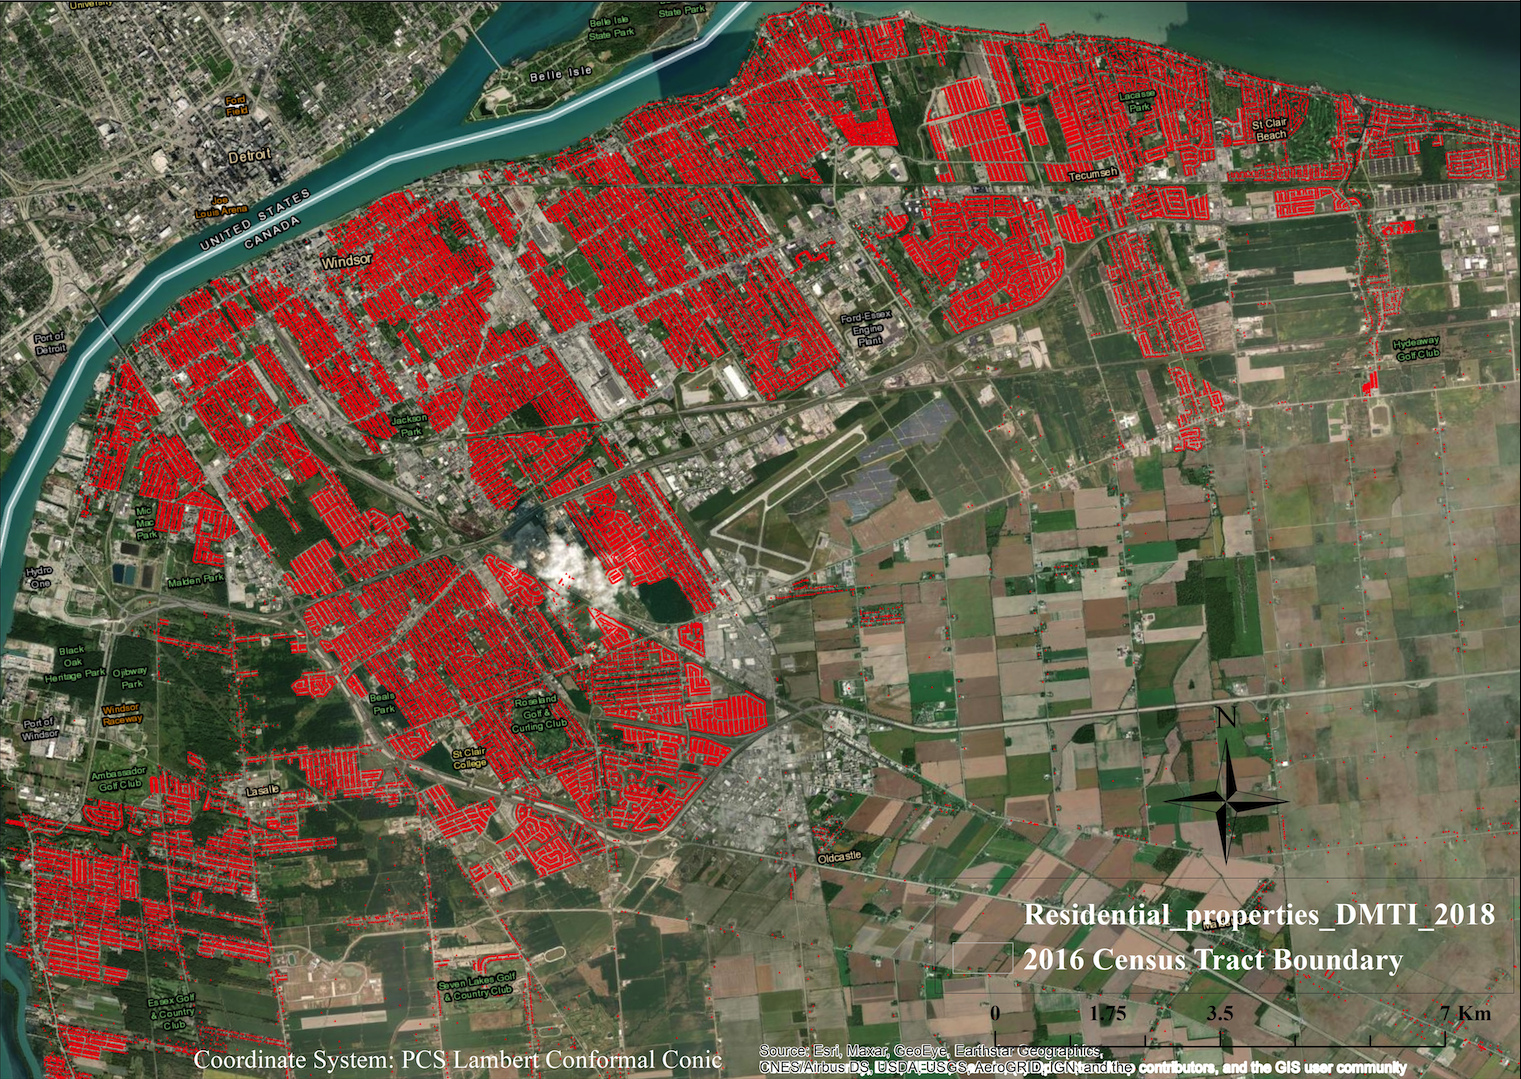 | 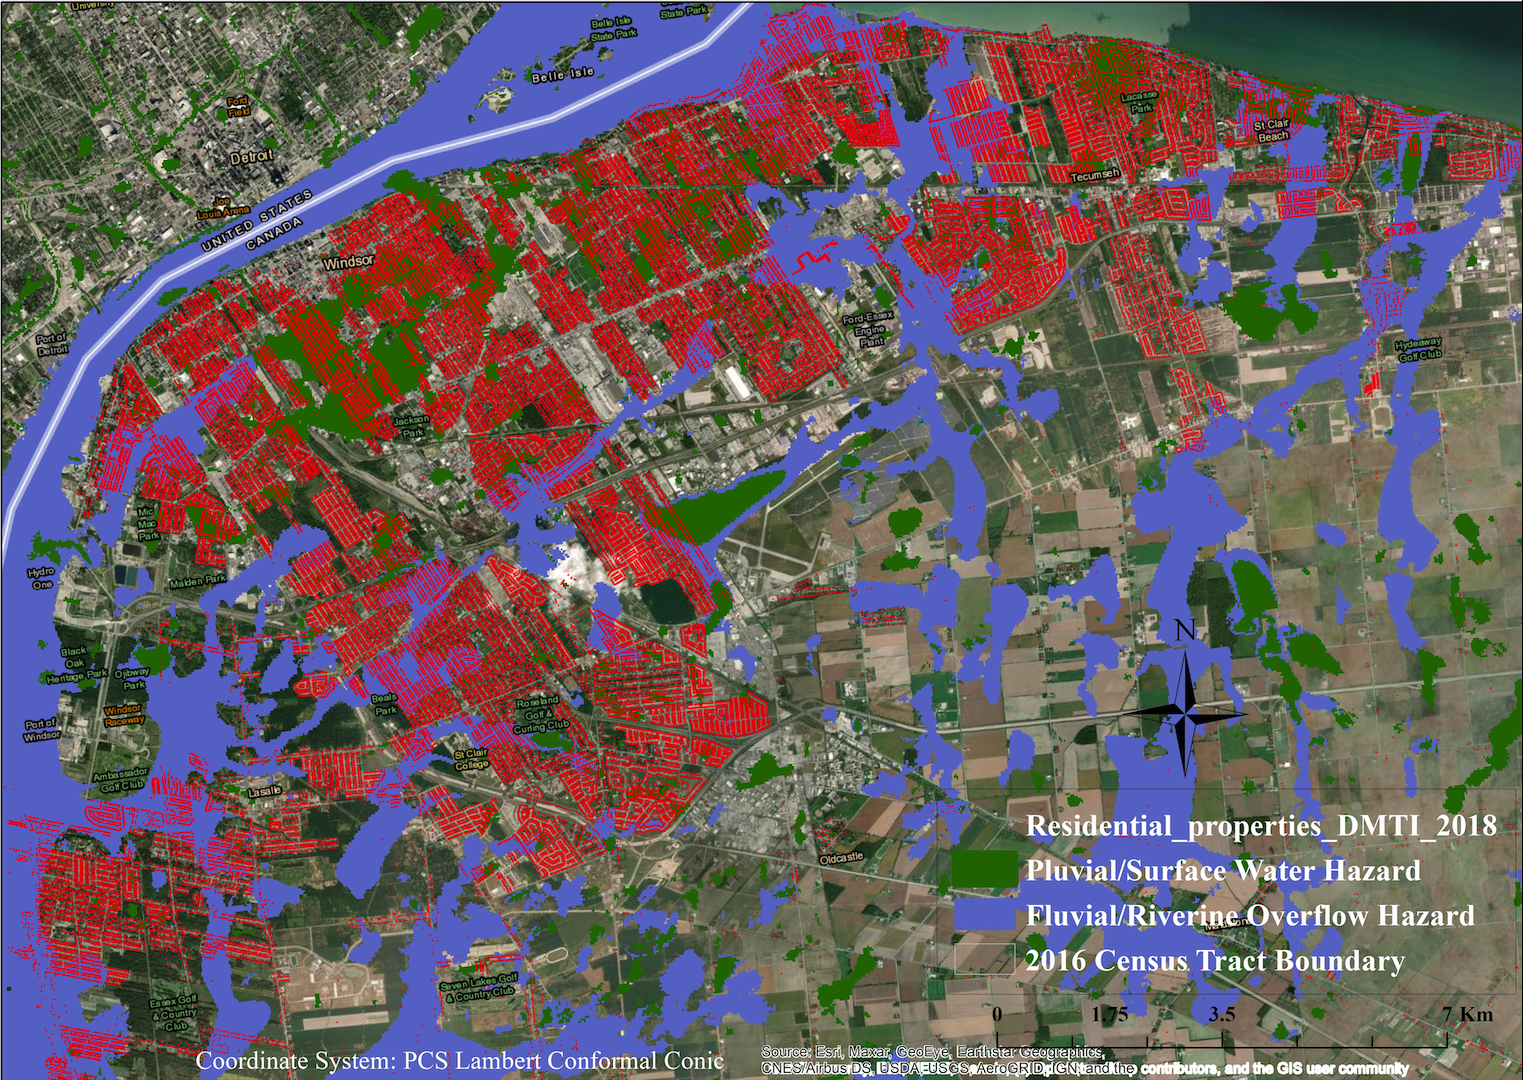 |
Using the plotted outlines of residential properties, a binary analysis (1=yes; 2=no) was used to indicate whether a property intersected with the flood hazard area. The Windsor CMA contains 73 census tracts. There are 118,038 residential properties spread across these tracts, with at least 74 residential properties in each. The GIS-based exposure analysis results were summarized in a spreadsheet and then joined spatially with the census-tract-level cartographic boundary. This analysis revealed 26,722 residential properties (22.6 per cent) exposed to fluvial flood hazard and 19,582 residential properties (16.6 per cent) exposed to pluvial flood hazard.
3.2 Socioeconomic vulnerability index
The socioeconomic vulnerability index was developed by compiling relevant indicators that measure a neighbourhood’s social deprivation relative to others. Deprivation indices are designed to capture the socioeconomic status of residents at a neighbourhood level (Bell & Hayes, 2012; Chan et al., 2015). Two deprivation indices—neighbourhood instability and economic insecurity—were most relevant for this objective.
The neighbourhood instability index defines levels of social deprivation by measuring the proportion of the population that would most struggle to recover from unexpected shocks or disruptions. Key indicators for this index include a lack of home ownership, insufficient income, high shelter costs relative to income, lack of a private vehicle, and precarious work or unemployment. By comparison, the economic insecurity index defines levels of social deprivation by measuring the distribution of the population that suffers from insufficient economic resources to sustain a median level of social welfare. People are considered economically insecure if they live in a dwelling requiring significant repair, inhabit a property valued lower than the Canadian median, lack a high school education, require social assistance, or suffer from a physical disability.
These indices provide an additional benefit for socioeconomic vulnerability analysis because they can be linked with demographic census data. Evaluating this relationship can determine whether historically marginalized or disadvantaged populations live in neighbourhoods with high levels of deprivation, in addition to hazard exposure. Descriptive statistics of variables used in the case study are reported in Table A.1 (Appendix A). Methods used to construct the neighbourhood deprivation index and ensure its validity and reliability are described in Appendix B.
3.3 Hot spot analysis: The intersection of flood exposure and socioeconomic vulnerability
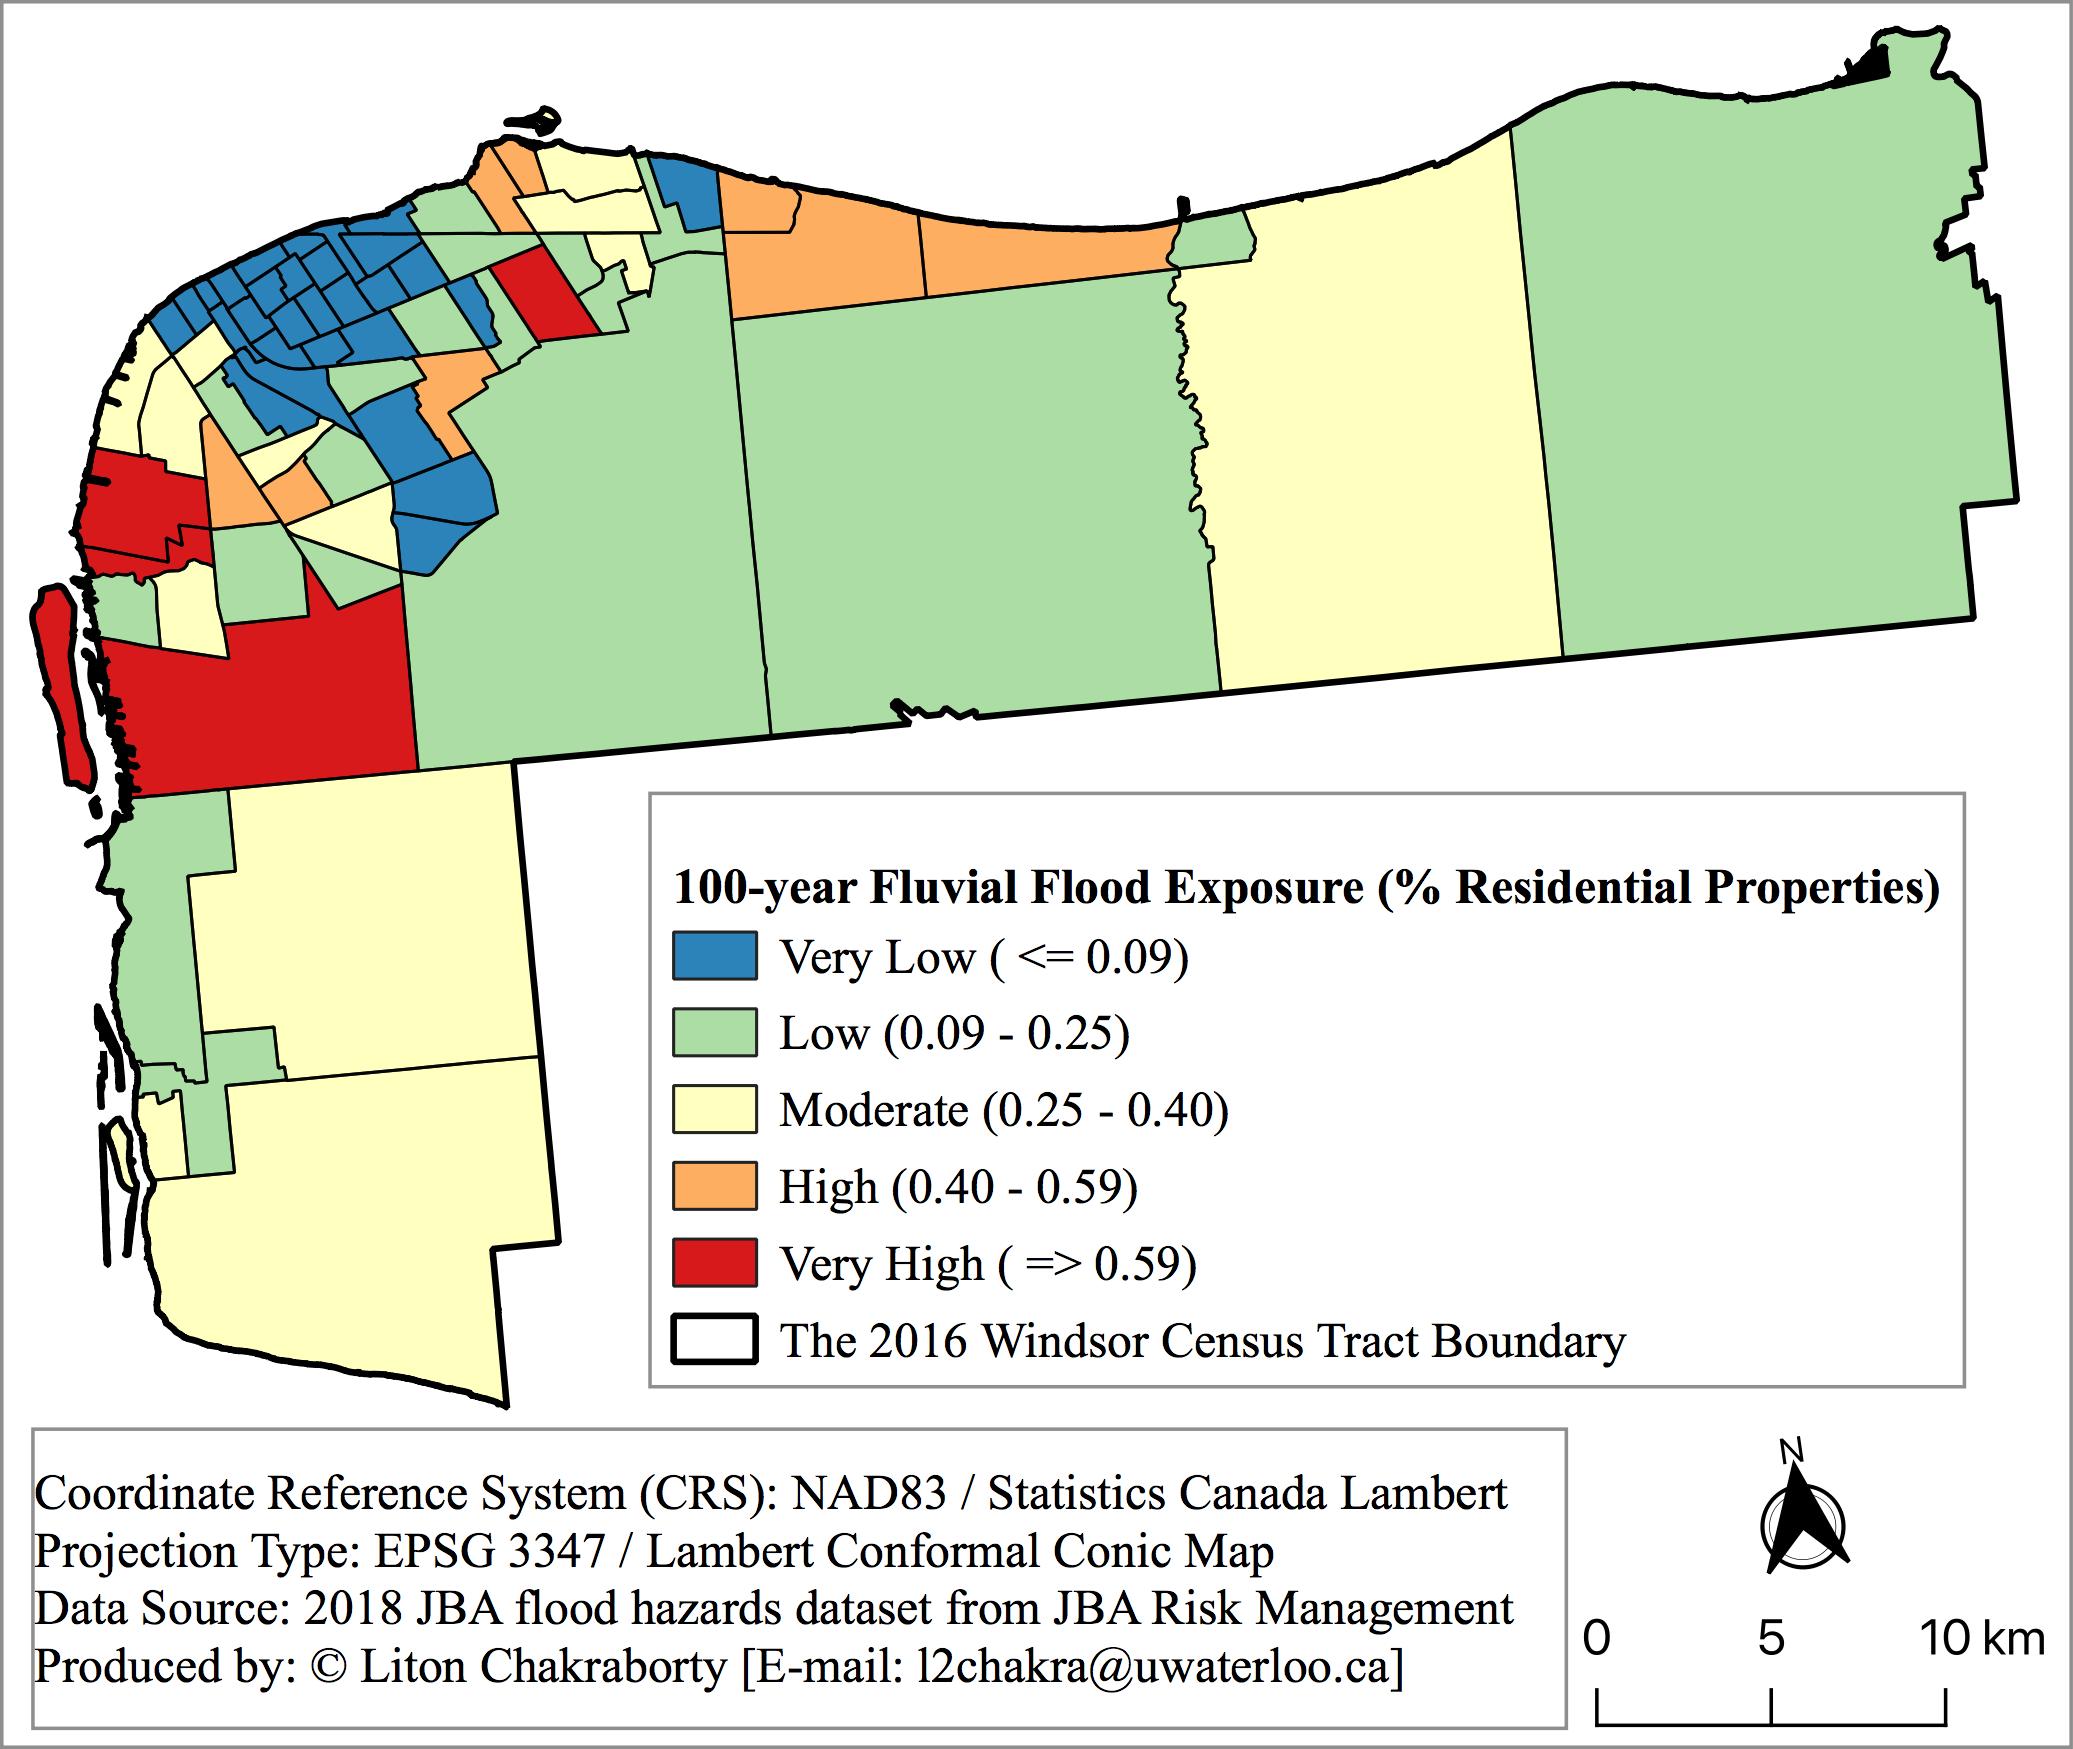
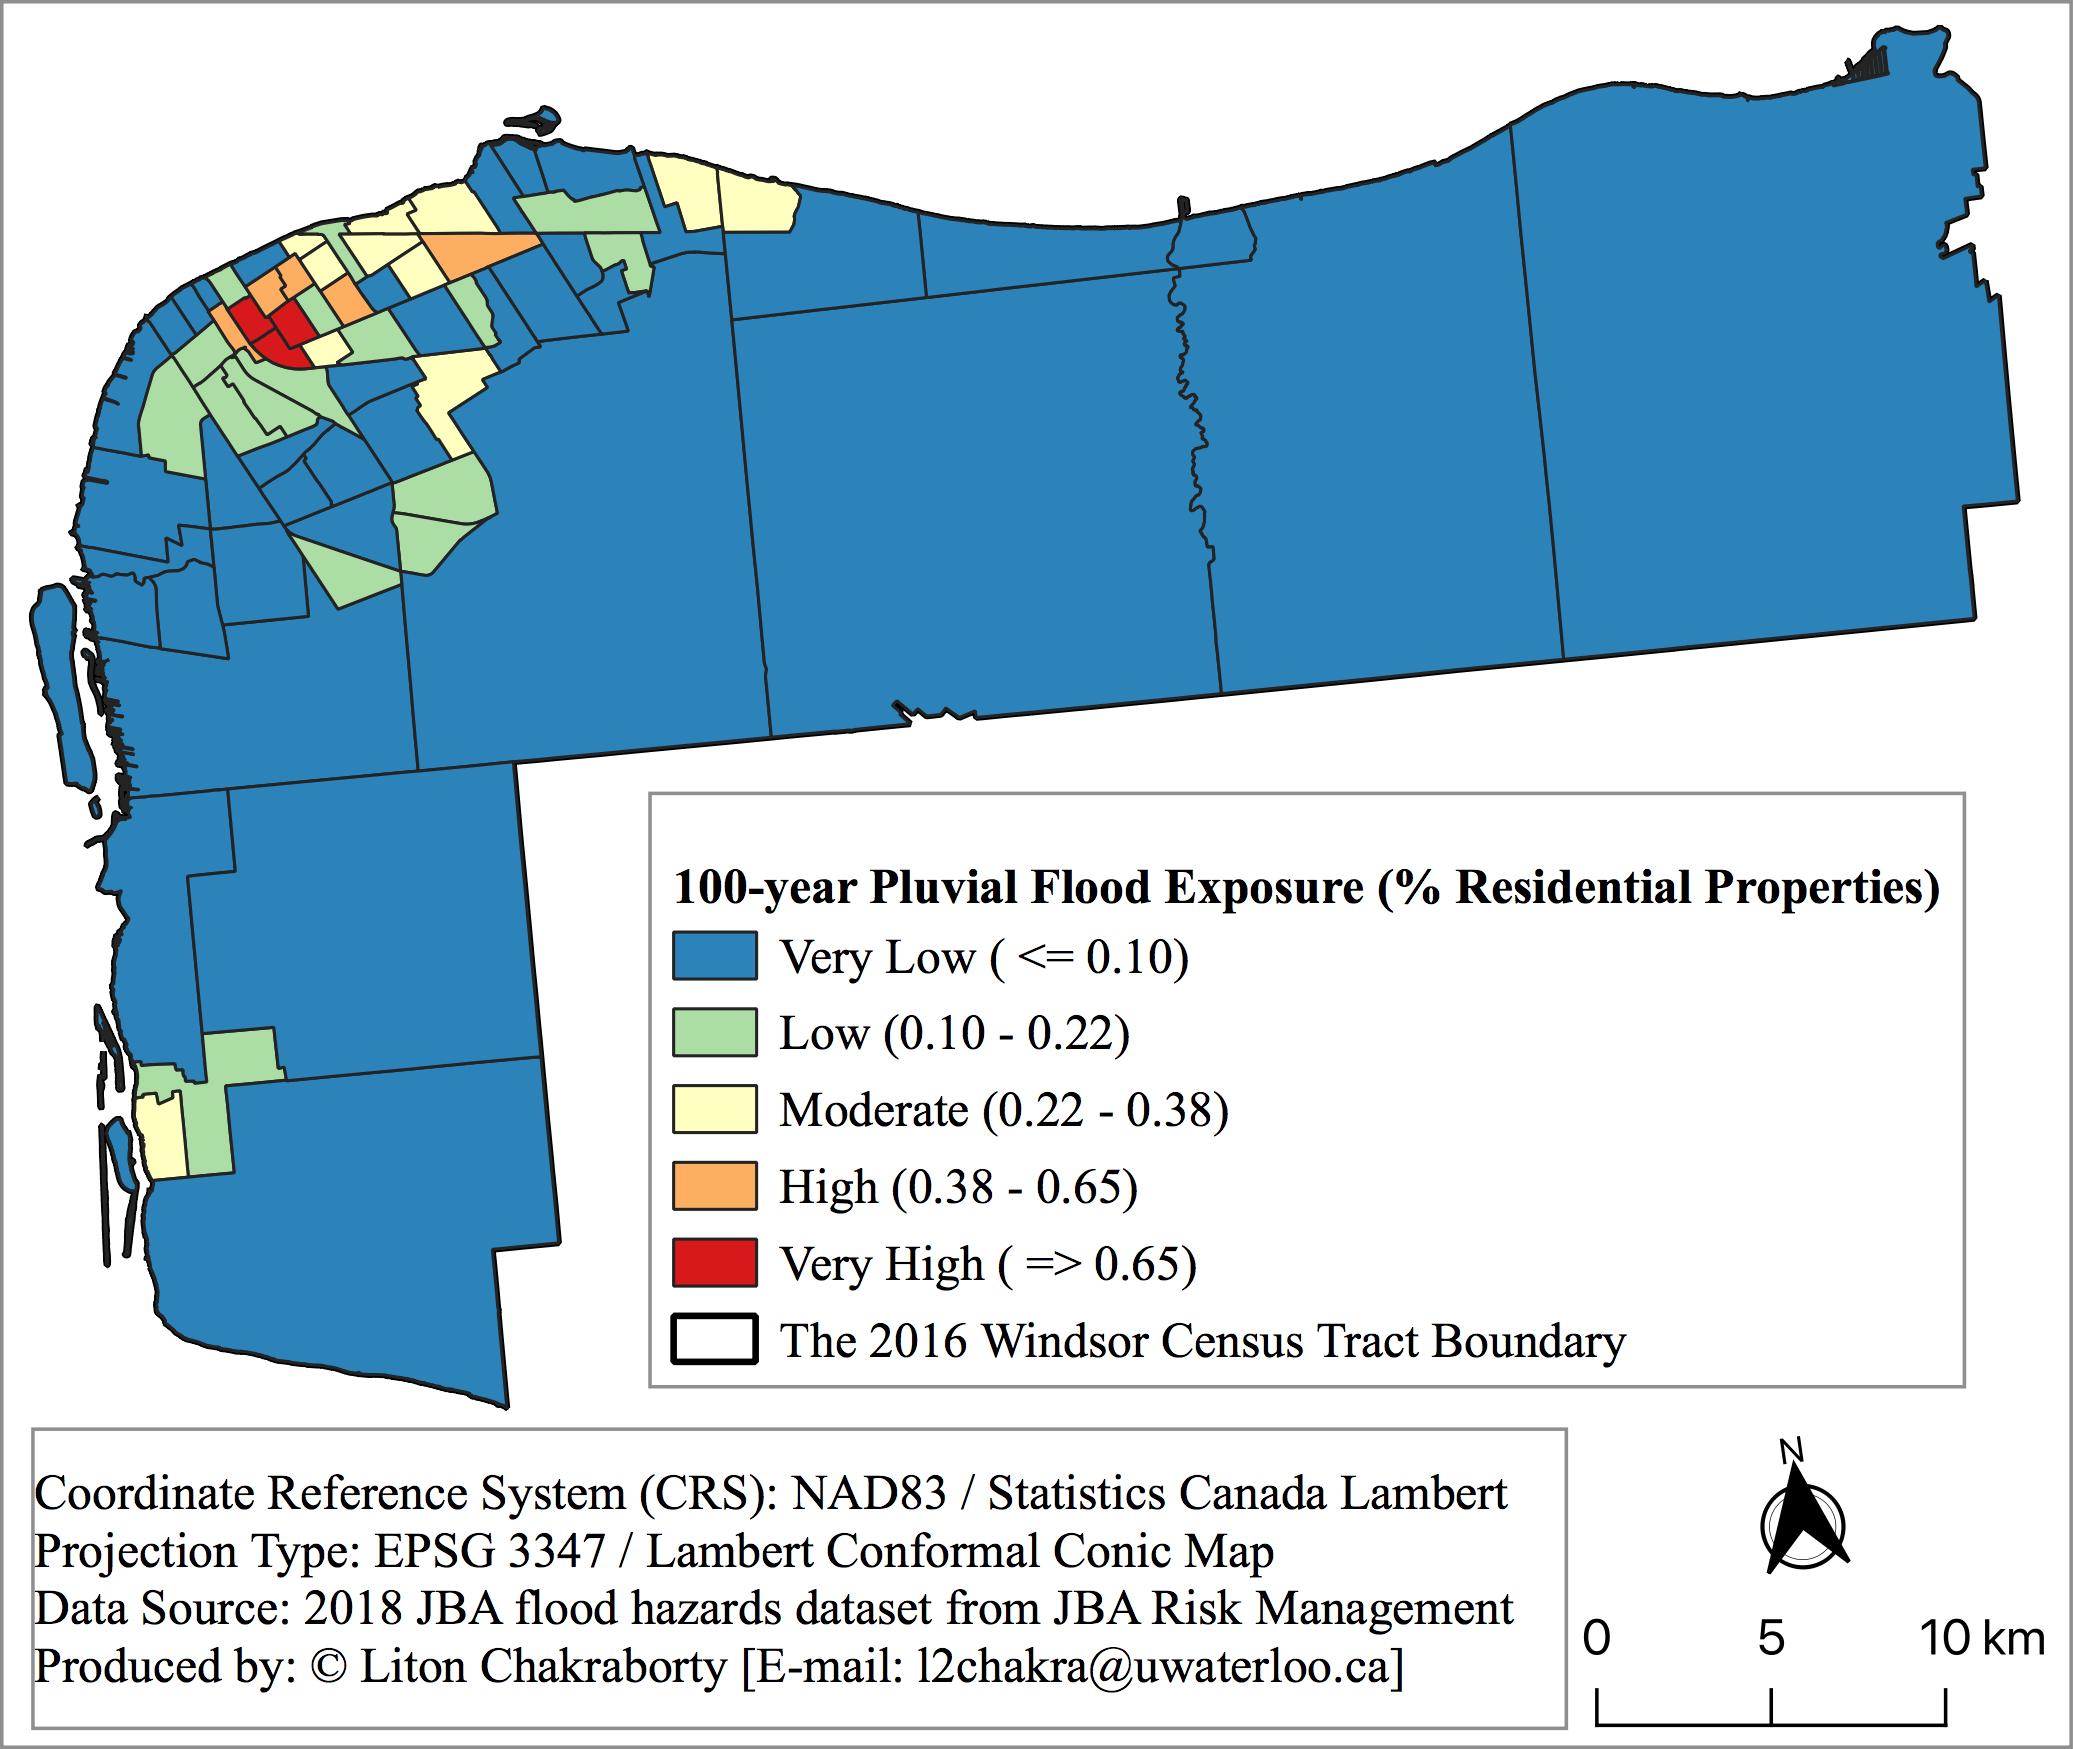
To identify areas at high risk of fluvial flooding, census tracts were classified and mapped into five categories and corresponding colour codes, including very low, low, moderate, high, and very high, based on the percentage of properties exposed to flood hazards (Figure 2a) and their socioeconomic vulnerability scores (Figure 2b). When these maps were combined, census tracts with both high or very high flood exposure and high or very high socioeconomic vulnerability were identified as hot spots of flood risk (colour-coded orange and red) (Figure 2c). The same process was repeated for pluvial flooding (Figures 3a, 3b, 3c).
Figure 2. Flood Risk Assessment for Windsor CMA (Fluvial)
| (a) Flood hazard exposure | (b) Socioeconomic vulnerability |
 |  |
(c) Fluvial flood risk | |
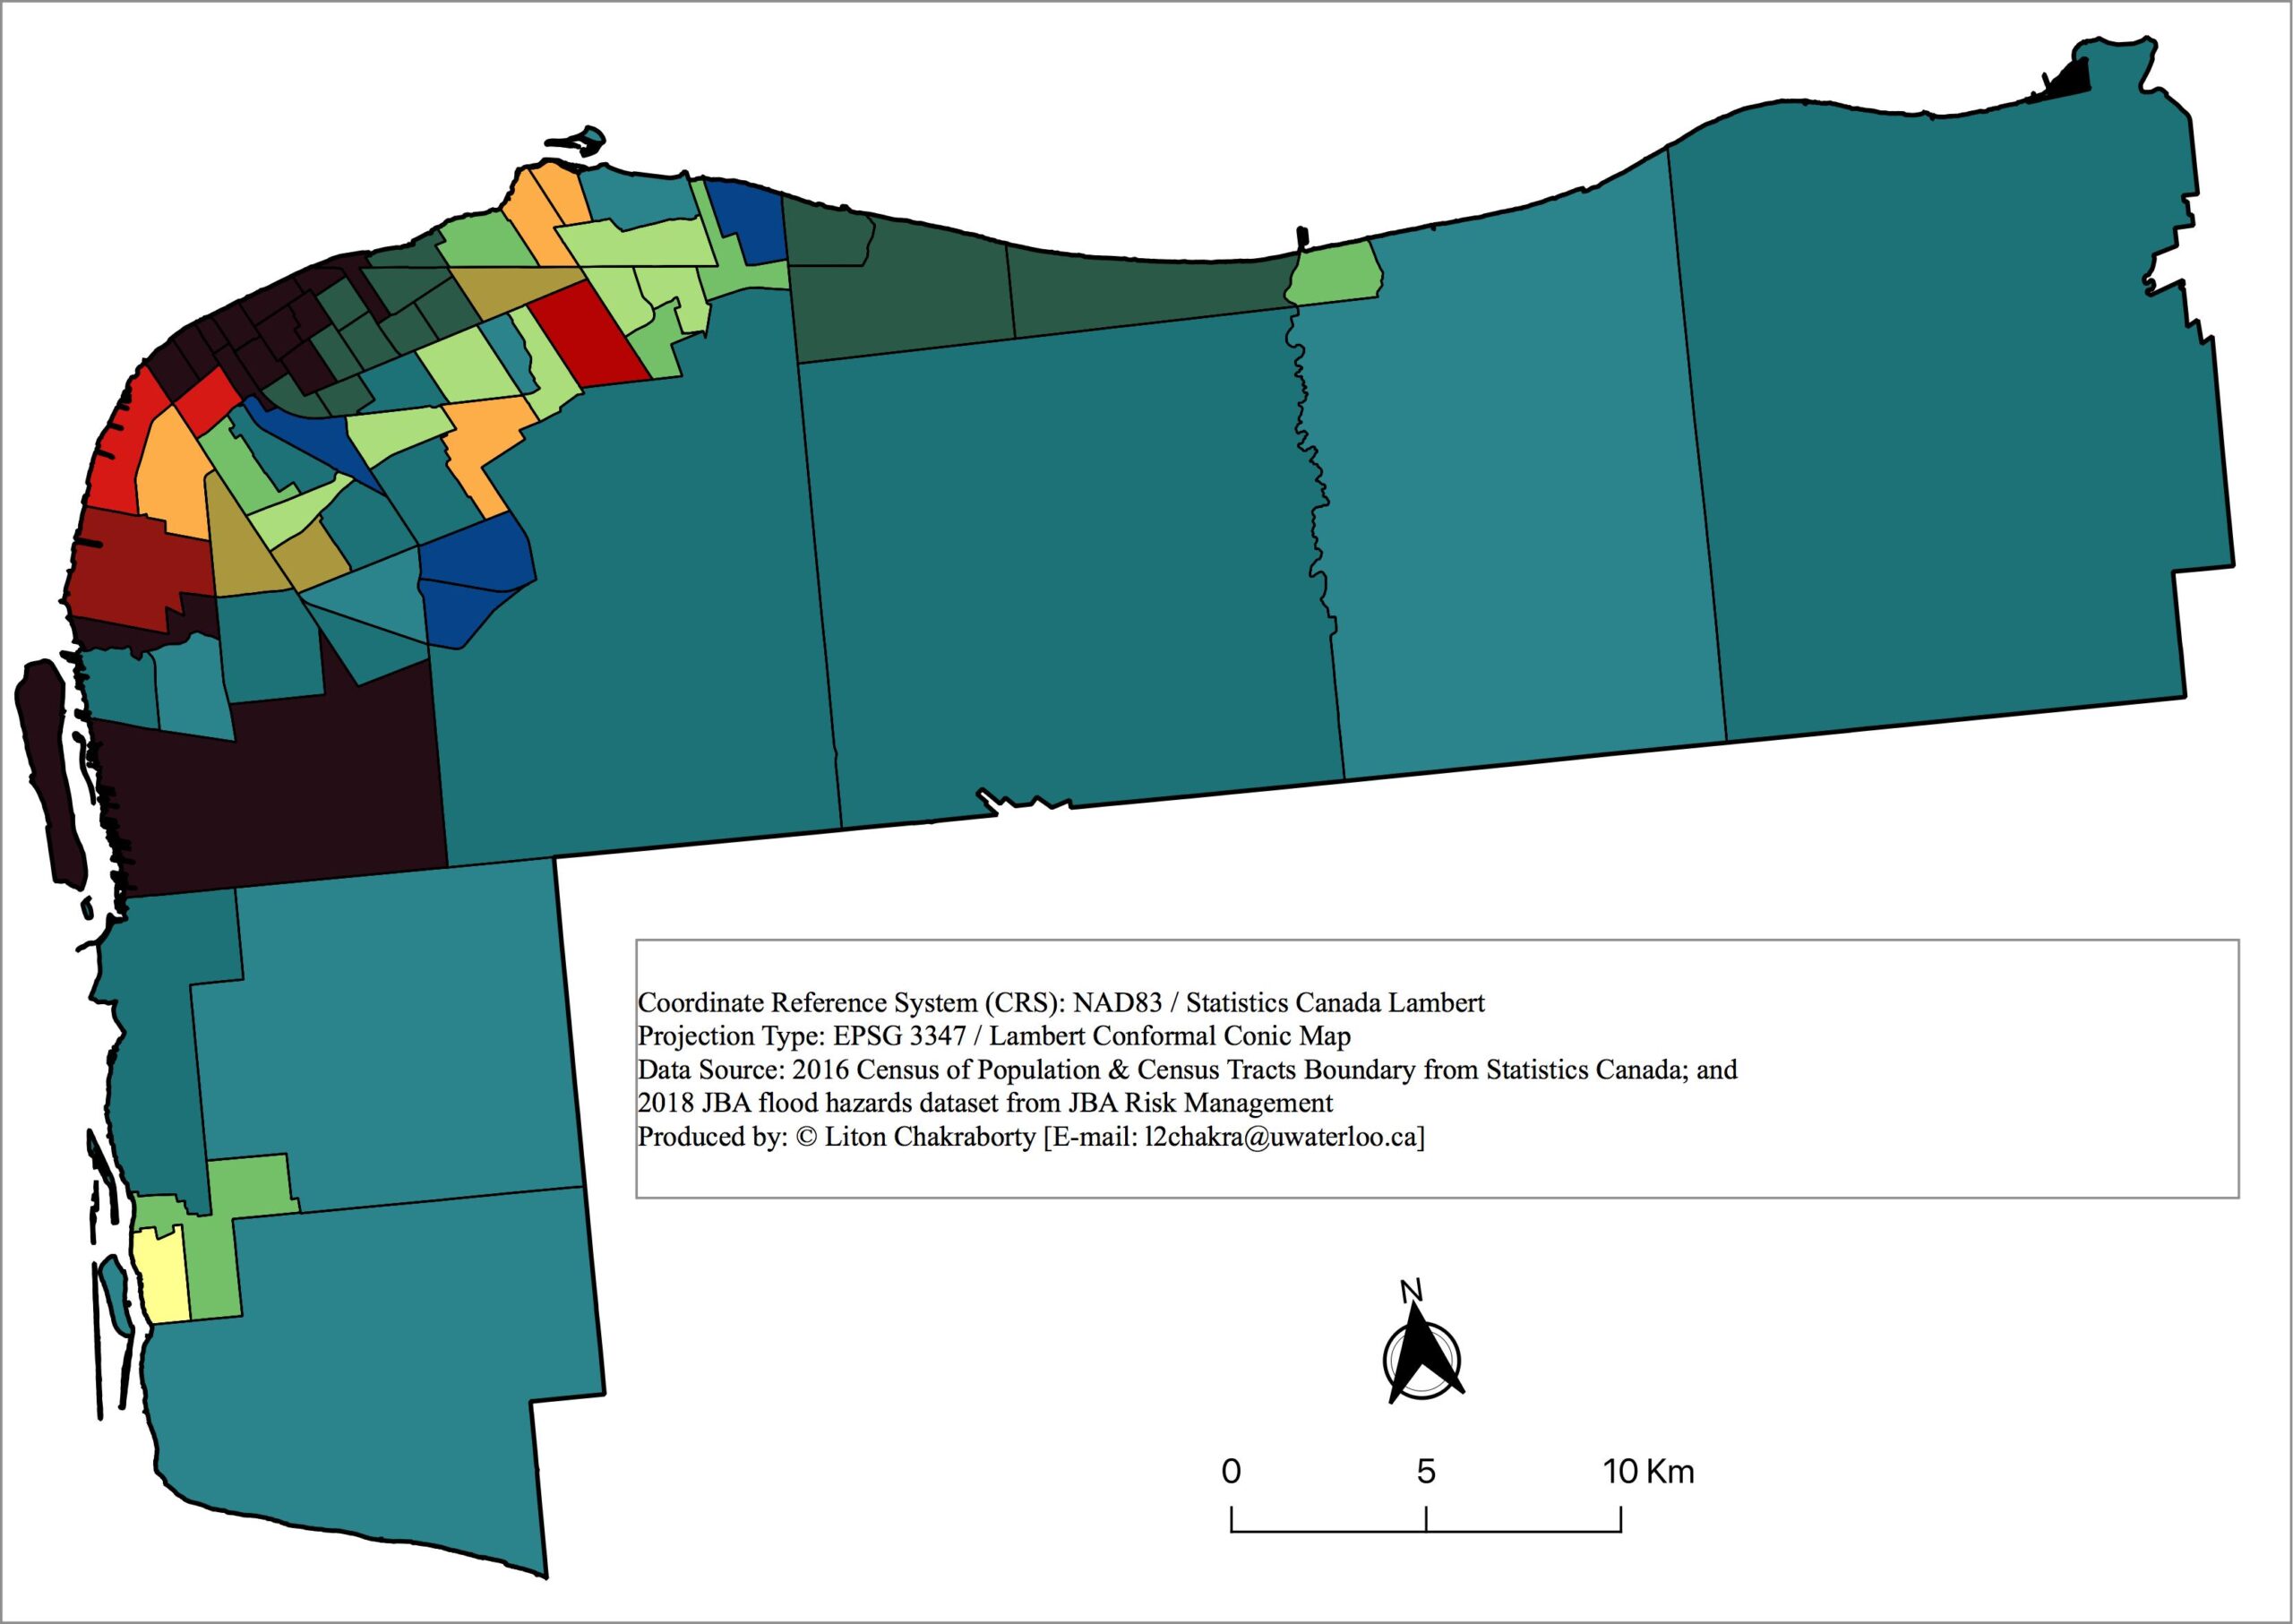 | 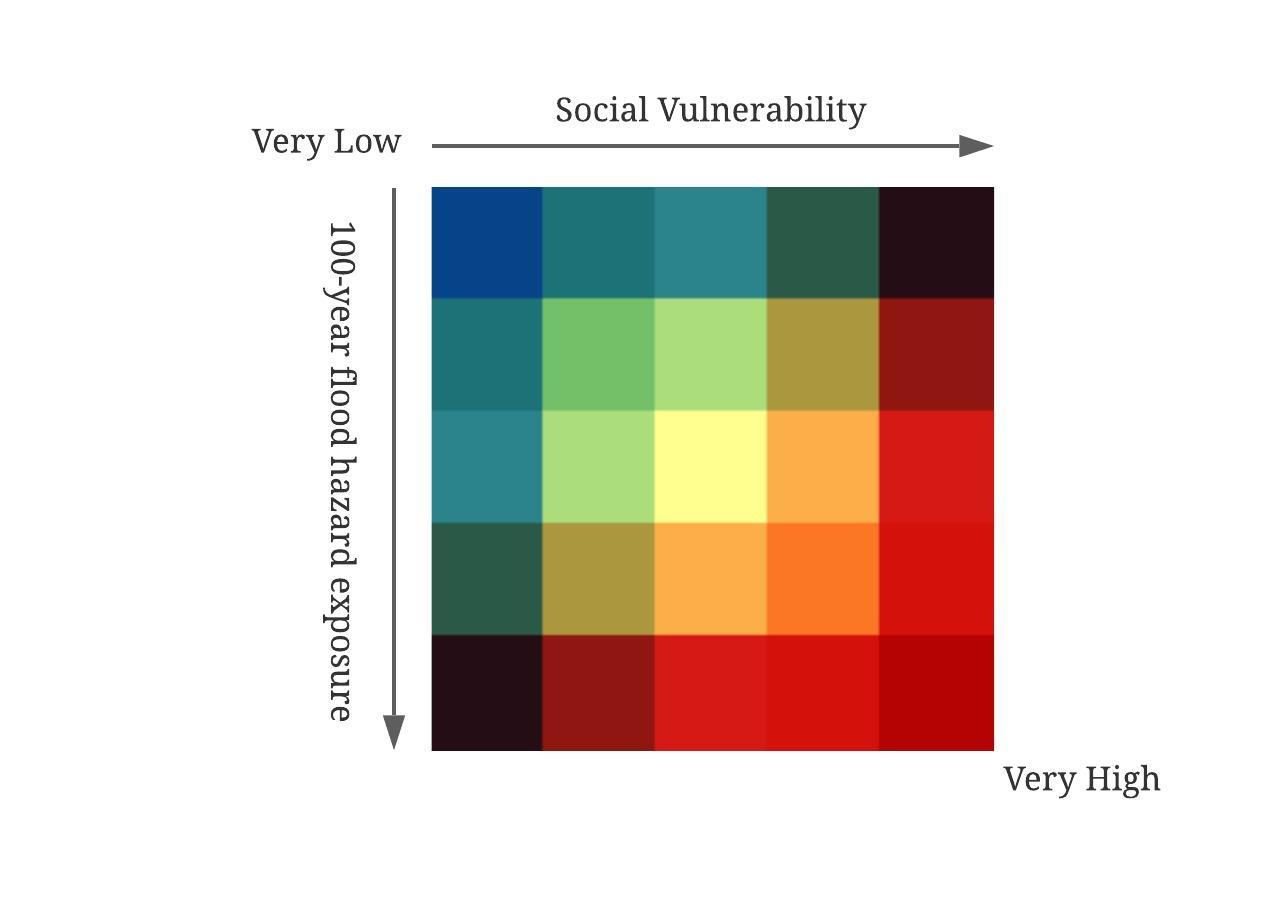 |
Figure 3. Flood Risk Assessment for Windsor CMA (Pluvial)
| (a) Flood hazard exposure | (b) Socioeconomic vulnerability |
 | |
(c) Pluvial flood risk | |
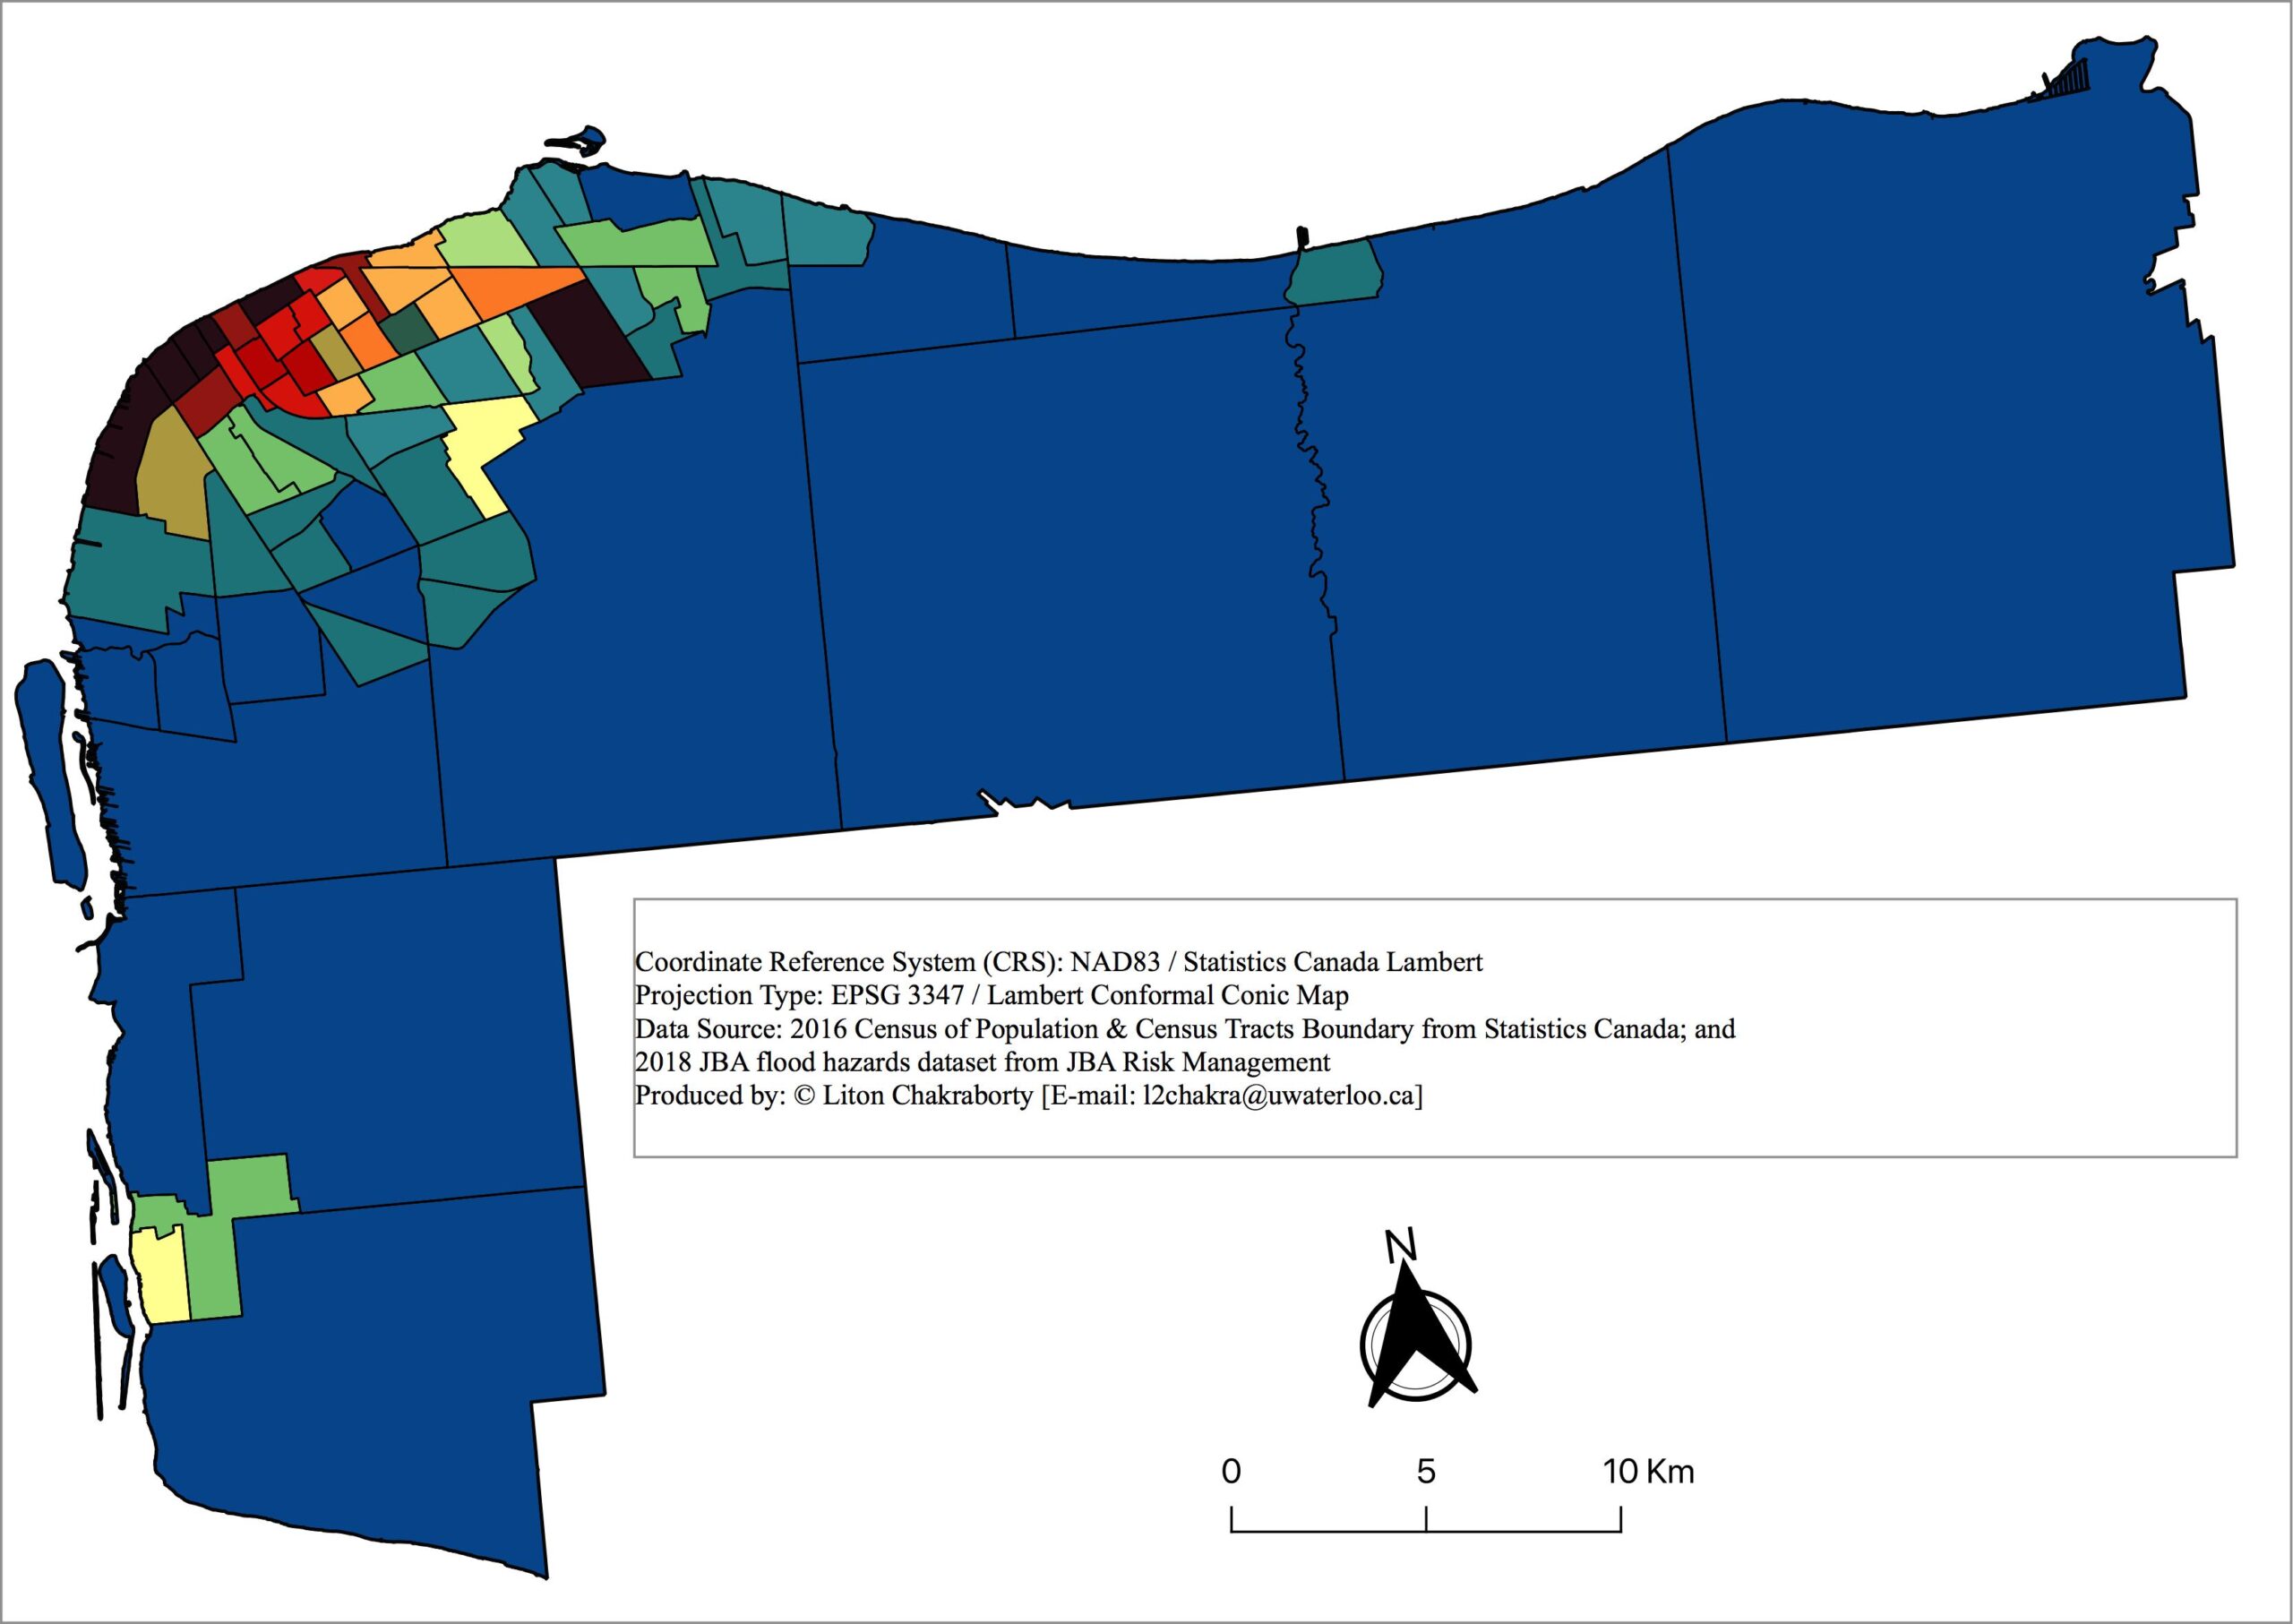 | |
These maps indicate that both flood hazard exposure of residential properties and socioeconomic vulnerability vary significantly across census tracts in Windsor CMA. Flood risk is concentrated in census tracts where residential properties and populations occupy inland flood zones (mainly the northeast corner of the City of Windsor). Riverine (fluvial) risk intersects with socioeconomic vulnerability in census tracts along the Detroit River, whereas surface water (pluvial) risk intersects with socioeconomic vulnerability primarily in dense downtown neighbourhoods.
3.4 Correlation analysis to inform flood-related inequities
To better understand flood-related environmental inequities, an analysis was conducted to determine correlations between flood exposure and several demographic variables that past research has associated with populations who experience social inequity and injustice. These variables are summarized in Table A.1 (Appendix A).
Based on census data, visible minority populations were grouped as ‘South Asian’, which included people of Chinese, Filipino, Japanese, Korean, and Southeast Asian origin, or ‘Other’, which included people of Arabian, Latin American, and West Asian origin. The Indigenous population subgroup consisted of Aboriginal peoples and people with first ethnic origin identified as First Nations, Inuit, or Métis. Consistent with other Canadian environmental justice and equity analyses (Bocquier et al., 2013; Carrier et al., 2016b, 2016a; Dale et al., 2015), four other socio-demographic characteristics of the population were used in addition to race/ethnicity and neighbourhood deprivation indices. These included (1) per cent female; (2) per cent population aged 65 and over; (3) per cent population aged 15 and under; and (4) per cent population living alone.
Bivariate correlation coefficients are useful to evaluate whether certain populations that are historically marginalized also face disproportionate flood risk relative to other groups (J. Chakraborty et al., 2019; Grineski et al., 2015). This study used Pearson’s correlation coefficients to test the hypothesis that socioeconomically deprived groups disproportionately inhabit inland flood hazard areas, such as fluvial and pluvial flood zones of Windsor (Table 3).
Table 3. Bivariate Correlation Coefficients and Statistical Significance
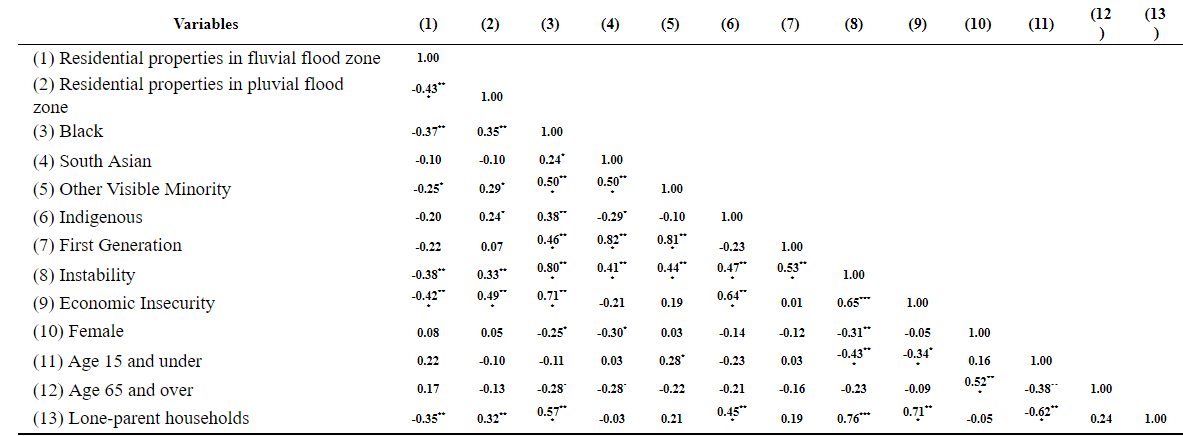
The correlation analysis revealed some statistically significant findings. As indicated by the correlation coefficient of 0.35** in column (2), for instance, Black households are more exposed to surface water (pluvial) flood risk than other population subgroups considered in this study. Indigenous peoples, other visible minorities, and lone-parent households are also highly exposed to pluvial flooding. In addition, pluvial flood risk is more significant in areas with higher neighbourhood instability and economic insecurity.
However, the same correlations were not found for riverine (fluvial) risk, as most of the coefficients in column (1) indicated either negative or statistically insignificant relationships between flood exposure and racial/ethnic and socioeconomic characteristics. For example, the coefficient of -0.37** in column (1) suggests Black households are at lower risk of fluvial flooding. Similarly, the coefficient of -0.20 for Indigenous populations in column (1) indicates that fluvial flood risk for Indigenous residents does not differ significantly from other population subgroups. These results possibly indicate that there are no significant racial and social disparities in exposure to riverine flooding in Windsor CMA. In other words, marginalized and racialized populations in Windsor are likely more exposed to pluvial flood risk compared to fluvial risk.
4. Policy implications for flood risk management
Incorporating measures of socioeconomic vulnerability into flood risk assessment offers several benefits. First, it provides a more comprehensive and robust picture of flood risk. In the case of Windsor, Ontario, the addition of socioeconomic vulnerability revealed that fluvial flood risk is concentrated in areas outside of those captured in more traditional methods that are limited to hazard exposure and physical vulnerability. The pluvial socioeconomic vulnerability analysis revealed that the distribution of risk is more complex and nuanced than what is captured by exposure assessment alone. Subsequent analysis on the distribution of risk across marginalized and racialized populations revealed the potential environmental injustice associated with flood risk in the Windsor CMA. Replicating this type of analysis in other municipalities could reveal different but equally important conclusions about how socioeconomic vulnerability intersects with flooding.
Better risk assessments can focus government policies on people and communities that would benefit most from flood risk reduction. For instance, riverine (fluvial) flood risk is the primary focus of federal and provincial programs, but surface water (pluvial) flooding is a rapidly growing source of risk as increasingly heavy rainfall in a warming climate overwhelms drainage infrastructure and water flows into streets and nearby structures (Gaur et al., 2019). As this analysis shows, even if people live far away from rivers, certain marginalized and racialized groups may experience high flood risk due to their exposure to surface water flooding and higher socioeconomic vulnerability.
The findings also suggest some implications for flood risk management policy. Flood risk communication and education, for example, aim to inform residents about flood risk and encourage household preparedness. Given the correlation between flood risk and marginalized and racialized communities, this analysis suggests that these communication and education campaigns should be tailored and targeted to reach the most vulnerable (Ziolecki & Thistlethwaite, 2019).
The risk assessment and mapping also offer a means to better calibrate non-flood related social programs and policies targeting these communities. As noted above, urban flood risk is the product of interaction between a flood hazard, the exposure of people and assets, and the vulnerability of people and assets to flood impacts. Whereas physical infrastructure can reduce the damage from flood events and purposeful planning can reduce exposure of people and assets, flood risk can also be reduced through social programs that target the determinants of socioeconomic vulnerability, such as low income, unemployment, and high shelter costs (Joakim & Doberstein, 2013; McEntire, 2012). For example, targeted funding made available through disaster assistance programs, subsidies, or vouchers could improve the affordability of flood insurance, which would improve the resilience of communities to recurring flood events, while reducing overall socioeconomic vulnerability.
5. Conclusion
This case study examined the feasibility of combining geospatial and statistical methods for understanding and assessing socioeconomic vulnerability to flood hazards. Based on its high exposure to varying flood risks, the CMA of Windsor, Ontario, was chosen as a worthwhile place to incorporate socioeconomic vulnerability into flood risk assessment. The method employed multiple datasets and statistical methods to triangulate how flood risk changes in response to socioeconomic vulnerability. The findings confirm that there are significant benefits to expanding Canada’s historical approach to risk assessment beyond hazard, exposure, and physical vulnerability to include socioeconomic vulnerability. In the case of Windsor, the incorporation of socioeconomic vulnerability shifted the scale and location of both pluvial and fluvial flood risk.
These findings suggest that policymakers should incorporate socioeconomic vulnerability into flood risk assessments. Indeed, existing approaches limit the benefits of flood risk management by directing resources to areas exposed to hazards but that may have lower levels of socioeconomic vulnerability, rather than areas with higher levels of socioeconomic vulnerability (L. Chakraborty, 2021). In the case of Windsor CMA, for example, some marginalized and racialized communities are highly exposed to pluvial flooding. Understanding the systemic forces that produced this outcome is important, as is the need to target flood mitigation and recovery resources to communities for whom this investment would reduce vulnerability and generate more benefits for the local economy.
It is important to note that the study revealed some areas of uncertainty that could be addressed to improve flood risk assessment using socioeconomic vulnerability. This study used top-down statistical aggregation and modelling that requires a process of “ground-truthing” to ensure its assumptions are valid based on local flood risk conditions. For example, Windsor has data on several recent floods that could be used to validate the flood model spatial outputs. Higher resolution digital elevation data and more refined hydrologic and hydraulic models could also improve the flood hazard layers to achieve more granular analysis than 30 metres.
In addition, the flood data does not include local flood defences such as berms and small dikes to contain fluvial hazards, so including this infrastructure could produce a different result concerning the distribution of flood extent and severity in the area. Rigorous exposure analysis is also needed to reduce uncertainty by including other important assets, such as roads, emergency and health infrastructure, and culturally significant sites. Lastly, because flood risks will continue to grow and change in a warming and increasingly volatile climate, the flood hazard and exposure data should be adjusted to incorporate climate change projections and ongoing land development, including exploring how different emissions and development scenarios influence risk over the coming decades.
Despite these limitations, this case study demonstrates the feasibility of using socioeconomic vulnerability to improve flood risk assessment and management. A key benefit could be improving the cost-effectiveness and equity of mitigation and recovery policies by ensuring resources are allocated to areas that need them most.
6. References (click to expand)
Agrawal, N., Armenakis, C., & Montpetit, M. (2014). Is flooding in Toronto a concern? Natural Hazards, 72(2), 1259–1264. https://doi.org/10.1007/s11069-014-1054-2
Armenakis, C., Du, E. X., Natesan, S., Persad, R. A., & Zhang, Y. (2017). Flood risk assessment in urban areas based on spatial analytics and social factors. Geosciences (Switzerland), 7(4), 1–15. https://doi.org/10.3390/geosciences7040123
Bartlett, M. S. (1954). A Note on the Multiplying Factors for Various Chi-squared Approximations. Journal of the Royal Statistical Society, 16(2), 296–298.
Battagello, D. (2020, March 9). Huge flooding woes on horizon for several areas in Windsor-Essex, ERCA says | Windsor Star. https://windsorstar.com/news/local-news/huge-flooding-woes-on-the-horizon-for-several-areas-in-windsor-essex-erca-says
Bell, N., & Hayes, M. V. (2012). Vancouver area neighbourhood deprivation index. Canadian Journal of Public Health, 103(Supplement 2), 528–532.
Bocquier, A., Cortaredona, S., Boutin, C., David, A., Bigot, A., Chaix, B., Gaudart, J., & Verger, P. (2013). Small-area analysis of social inequalities in residential exposure to road traffic noise in Marseilles, France. European Journal of Public Health, 23(4), 540–546. https://doi.org/10.1093/eurpub/cks059
Burn, D. H., Whitfield, P. H., & Sharif, M. (2016). Identification of changes in floods and flood regimes in Canada using a peaks over threshold approach. Hydrological Processes, 30(18), 3303–3314. https://doi.org/10.1002/hyp.10861
Canadian Underwriter. (2017, August 31). City of Windsor records nearly 2,700 basement flooding reports from severe rain event Canadian Underwriter. https://www.canadianunderwriter.ca/insurance/city-windsor-records-nearly-2700-basement-flooding-reports-severe-rain-event-1004119926/
Carrier, M., Apparicio, P., & Séguin, A. M. (2016a). Road traffic noise geography during the night in Montreal: An environmental equity assessment. Canadian Geographer, 60(3), 394–405. https://doi.org/10.1111/cag.12281
Carrier, M., Apparicio, P., & Séguin, A. M. (2016b). Road traffic noise in Montreal and environmental equity: What is the situation for the most vulnerable population groups? Journal of Transport Geography, 51, 1–8. https://doi.org/10.1016/j.jtrangeo.2015.10.020
CBC News. (2017, September 11). Number of Windsor basement flooding reports tops 6,000 | CBC News. https://www.cbc.ca/news/canada/windsor/number-of-windsor-basement-flooding-reports-tops-6-000-1.4284041
CBC News. (2020, July 27). City of Windsor approves $4.9B master plan to tackle flooding | CBC News. https://www.cbc.ca/news/canada/windsor/windsor-city-council-sewer-masterplan-1.5664651
Chakraborty, J., Collins, T. W., & Grineski, S. E. (2019). Exploring the environmental justice implications of Hurricane Harvey flooding in greater Houston, Texas. American Journal of Public Health, 109(2), 244–250. https://doi.org/10.2105/AJPH.2018.304846
Chakraborty, L. (2021). Social Equity Dimensions of Flood Risk Management in Canada. UWSpace [University of Waterloo]. http://hdl.handle.net/10012/17156
Chakraborty, L., Rus, H., Henstra, D., Thistlethwaite, J., & Scott, D. (2020). A place-based socioeconomic status index: Measuring social vulnerability to flood hazards in the context of environmental justice. International Journal of Disaster Risk Reduction, 43, 101394. https://doi.org/10.1016/j.ijdrr.2019.101394
Chan, E., Serrano, J., Chen, L., Stieb, D. M., Jerrett, M., & Osornio-Vargas, A. (2015). Development of a Canadian socioeconomic status index for the study of health outcomes related to environmental pollution Biostatistics and methods. BMC Public Health, 15(1), 1–8. https://doi.org/10.1186/s12889-015-1992-y
City of Windsor. (2018). Windsor, Ontario: 2016 Canada Census. https://www.citywindsor.ca/residents/planning/Plans-and-Community-Information/About-Windsor/Demographics/Documents/Windsor 2016 Census Complete Report.pdf
City of Windsor. (2021). Windsor Demographics. About Windsor. https://www.citywindsor.ca/residents/planning/Plans-and-Community-Information/About-Windsor/Demographics/Pages/Demographics.aspx
Collins, T. W., Grineski, S. E., Chakraborty, J., & Flores, A. B. (2019). Environmental injustice and Hurricane Harvey: A household-level study of socially disparate flood exposures in Greater Houston, Texas, USA. Environmental Research, 179(June), 108772. https://doi.org/10.1016/j.envres.2019.108772
Cronbach, L. J. (1951). Coefficient alpha and the internal structure of tests. Psychometrika, 16(3), 297–334. https://doi.org/10.1007/BF02310555
Cutter, S. L. (1996). Vulnerability to environmental hazards. Progress in Human Geography, 20(4), 529–539. https://doi.org/10.1177/030913259602000407
Cutter, S. L., Boruff, B. J., & Shirley, W. L. (2003). Social Vulnerability to Environmental Hazards. Social Science Quarterly, 84(2), 242–261. https://doi.org/10.1111/1540-6237.8402002
Cutter, S. L., Emrich, C. T., Morath, D. P., & Dunning, C. M. (2013). Integrating social vulnerability into federal flood risk management planning. Journal of Flood Risk Management, 6(4), 332–344. https://doi.org/10.1111/jfr3.12018
Dale, L. M., Goudreau, S., Perron, S., Ragettli, M. S., Hatzopoulou, M., & Smargiassi, A. (2015). Socioeconomic status and environmental noise exposure in Montreal, Canada. BMC Public Health, 15(1), 1–8. https://doi.org/10.1186/s12889-015-1571-2
DMTI Spatial Inc. (2018). DMTI CanMap Route Logistics [computer file].
Gaur, A., Gaur, A., Yamazaki, D., & Simonovic, S. P. (2019). Flooding related consequences of climate change on Canadian cities and flow regulation infrastructure. Water (Switzerland), 11(1). https://doi.org/10.3390/w11010063
Golnaraghi, M., Thistlethwaite, J., Henstra, D., & Stewart, C. (2020). Flood Risk Management in Canada: Building flood resilience in a changing climate. https://doi.org/10.1111/jfr3.12612
Grineski, S. E., Collins, T. W., Chakraborty, J., & Montgomery, M. (2015). Hazardous air pollutants and flooding: a comparative interurban study of environmental injustice. GeoJournal, 80(1), 145–158. https://doi.org/10.1007/s10708-014-9542-1
Guillard-Goncąlves, C., Cutter, S. L., Emrich, C. T., & Zêzere, J. L. (2015). Application of Social Vulnerability Index (SoVI) and delineation of natural risk zones in Greater Lisbon, Portugal. Journal of Risk Research, 18(5), 651–674. https://doi.org/10.1080/13669877.2014.910689
Holmes, R. R., & Dinicola, K. (2010). 100-Year Flood – It ’ s All About Chance. In U.S. Geological Survey General Information Product 106. https://pubs.usgs.gov/gip/106/pdf/100-year-flood_041210.pdf
Honegger, C., & Oehy, C. (2016). The road to flood resilience in Canada. https://www.preventionweb.net/files/49295_theroadtofloodresilienceincanada.pdf
Insurance Bureau of Canada. (2019). 2019 Facts of the Property and Casualty Insurance Industry in Canada. http://assets.ibc.ca/Documents/Facts Book/Facts_Book/2019/IBC-2019-Facts.pdf
Jakob, M., Holm, K., Lazarte, E., & Church, M. (2015). A flood risk assessment for the City of Chilliwack on the Fraser River, British Columbia, Canada. International Journal of River Basin Management, 13(3), 263–270. https://doi.org/10.1080/15715124.2014.903259
Joakim, E., & Doberstein, B. (2013). Policy Recommendations for Reducing Vulnerability to Disasters in Canada: Perspectives From Practitioners in Waterloo Region, Ontario. Risk, Hazards & Crisis in Public Policy, 4(4), 274–291. https://doi.org/10.1002/rhc3.12041
Kaiser, H. F. (1974). An index of factorial simplicity. Psychometrika, 39(1). https://doi.org/10.1007/BF02294054
Krishnan, V. (2010). Constructing an Area-based Socioeconomic Index: A Principal Components Analysis Approach. Early Child Development Mapping Project Alberta: Canada. https://pdfs.semanticscholar.org/b115/2cdc9e9ca217434db492a9e1c4ba519640ce.pdf
McEntire, D. (2012). Understanding and reducing vulnerability: From the approach of liabilities and capabilities. Disaster Prevention and Management, 21(2), 206–225. https://doi.org/10.1108/09653561211220007
Messer, L. C., Laraia, B. A., Kaufman, J. S., Eyster, J., Holzman, C., Culhane, J., Elo, I., Burke, J. G., & O’Campo, P. (2006). The development of a standardized neighborhood deprivation index. Journal of Urban Health, 83(6), 1041–1062. https://doi.org/10.1007/s11524-006-9094-x
Qiang, Y. (2019). Flood exposure of critical infrastructures in the United States. International Journal of Disaster Risk Reduction, 39(June), 101240. https://doi.org/10.1016/j.ijdrr.2019.101240
Statistics Canada. (2017). Windsor [Census metropolitan area], Ontario and Canada [Country] (table). Census Profile. 2016 Census. Statistics Canada Catalogue no. 98-316-X2016001. Ottawa. Released November 29, 2017. https://www12.statcan.gc.ca/census-recensement/2016/dp-pd/prof/details/page.cfm?Lang=E&Geo1=CMACA&Code1=559&Geo2=PR&Code2=01&SearchText=Canada&SearchType=Begins&SearchPR=01&B1=All&TABID=1&type=0
Statistics Canada. (2018). Census dictionary: 2016 Census of population. In The Daily: Component of Statistics Canada catalogue no. 11-001-X (Issue 98). https://www12.statcan.gc.ca/census-recensement/alternative_alternatif.cfm?t=98-301-x2016001-eng.pdf&keng=4323&kfra=4480&l=eng&loc=/census-recensement/2016/ref/dict/98-301-x2016001-eng.pdf
Statistics Canada. (2019). Dictionary, Census of Population, 2016: Complete A to Z index. https://www12.statcan.gc.ca/census-recensement/2016/ref/dict/az1-eng.cfm
Wisner, B., Blaikie, P., Cannon, T., & Davis, I. (2004). At Risk: Natural Hazards, People’s Vulnerability, and Disasters (2nd ed.). Routledge. https://doi.org/10.4324/9780203428764
Zhang, X., Flato, G., Kirchmeier-Young, M., Vincent, L. A., Wan, H., Wang, X., Rong, R., Fyfe, J. C., & L, G. (2019). Changes in Temperature and Precipitation Across Canada. In Canada’s Changing Climate Report. https://changingclimate.ca/site/assets/uploads/sites/2/2018/12/CCCR-Chapter4-TemperatureAndPrecipitationAcrossCanada.pdf
Ziolecki, A., & Thistlethwaite, J. (2019). Communicating Flood Risk to Canadians: Understanding the Challenges and Developing Best Practices. Findings from a Research Workshop.
7. Appendix A: Description of variables
Table A.1. Descriptive Statistics
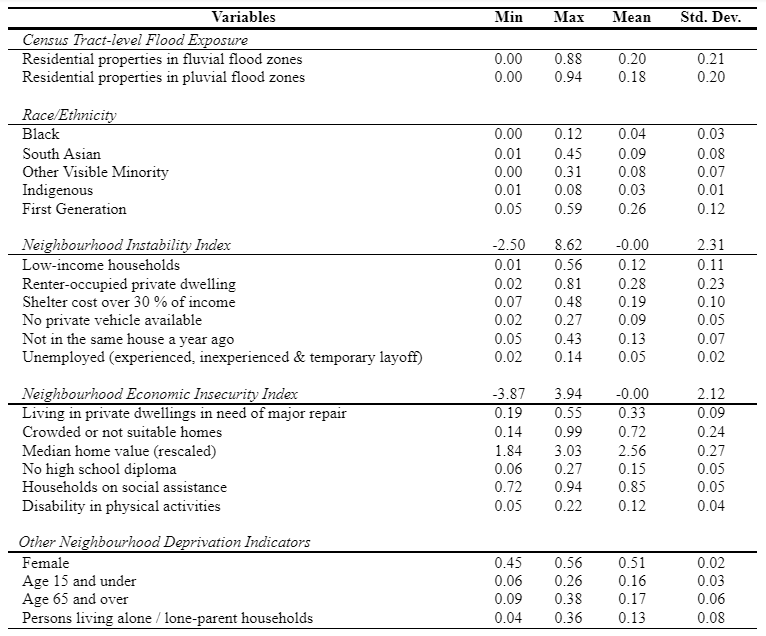
All variables in Table A.1 except owner-occupied home values represent census-tract-level proportions. The log of median home value variable is rescaled by subtracting census-tract-level individual values of the variable from its maximum value. The higher the difference between the highest value and census-tract-level particular value of the variable, the more severe and significant the neighbourhood-level socioeconomic deprivation the variable represents.
8. Appendix B: Principal component analysis
Following the methodology to construct a neighbourhood deprivation index (Messer et al., 2006), principal component analysis was applied with the Kaiser criterion on 17 standardized socioeconomic variables to identify significant neighbourhood deprivation indicators. Several other methods were used to examine multicollinearity problems, validity, and reliability of the dataset.7 As our selected census data passed all three diagnostics tests, we applied Principal component analysis on selected variables to extract independent componments, representing deprivation factors (Table B.1).
Table B.1. PCA Loading Scores and Post-Estimation
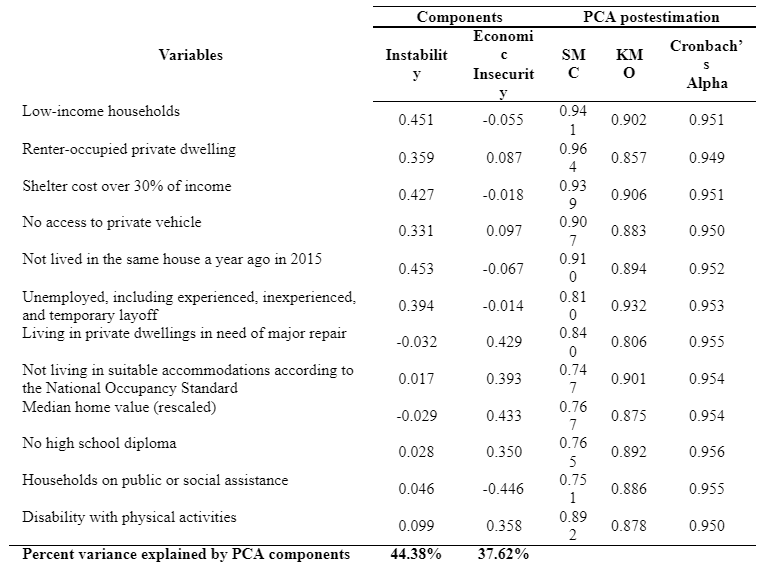
The data revealed that two deprivation components explained 82 per cent of the total variance. Since deprivation components and corresponding socioeconomic indicators increase socioeconomic vulnerability, a non-standardized socioeconomic vulnerability index (SoVI) was calculated by adding the absolute values of these components as suggested by Cutter et al. (2003) in the ‘hazard-of-place’ model of socioeconomic vulnerability (Guillard-Goncąlves et al., 2015). The index was then standardized, following the methods documented in Chakraborty et al. (2020), to rescale SoVI scores between 0 and 100 for ease of interpretation such that a SoVI score close to zero represents very low socioeconomic vulnerability and a SoVI score close to 100 indicates very high socioeconomic vulnerability. The index was then mapped using the choropleth mapping technique to visualize spatial disparities of socioeconomic vulnerability across census tracts in the Windsor CMA.
About the authors
Dr. Liton Chakraborty is a senior policy analyst in the Emergency Management and Programs Branch of Public Safety Canada. His research analyzes socioeconomic vulnerability, social inequities, and racial/ethnic disparities in environmental risks to consider gender-based analysis plus (GBA+) in federal decisions supporting equitable disaster and emergency management policy development for Canada.
Dr. Jason Thistlethwaite is an associate professor in the School of Environment, Enterprise and Development in the Faculty of Environment at the University of Waterloo, Associate Director of Partners for Action and Co-lead of the Climate Risk Research Group. His research focuses on innovative strategies to reduce the societal impacts of climate change and natural disasters.
Dr. Daniel Henstra is an associate professor of political science and co-lead of the Climate Risk Research Group at the University of Waterloo. His research focuses on the multi-level governance of complex policy areas such as climate change adaptation, emergency management, and flood risk management.
Footnotes
- A census tract is defined by Statistics Canada as a small, relatively stable geographic area that usually has a population of fewer than 10,000 people, based on data from the previous Census of Population Program (Statistics Canada, 2019). The census tract was the smallest unit of analysis that could be used for the case study, in order to maintain data confidentiality and Statistics Canada’s statistical output release guidelines for census data
- A single pixel represents a 30-metre-by-30-metre area on the ground.
- Principal component analysis is a method for reducing the number of variables in a large dataset by converting them to a smaller set of variables (i.e., principal components) while preserving as much information as possible. Its purpose is to make the data easier to visualize and compare.
- Some characteristics are based on 25 per cent sample data, such as no certificate, diploma, or degree; not in the labour force; owner-occupied private dwellings; renter-occupied private dwellings; visible minority; and unemployment rate (Statistics Canada, 2017).
- A dissemination block is defined by Statistics Canada as an area bounded on all sides by roads and/or boundaries of standard geographic areas (Statistics Canada, 2018). It is the smallest geographic area for which population and dwelling counts are disseminated.
- An address point is a single unit (e.g., apartment), so in some cases multiple addresses were in the same geographic location (e.g., condo building, duplex). For all address points, data attributes of LAT (latitude), LON (longitude), and PRIM_USE (primary use) were included in the dataset. A 15m buffer area was generated for any residential property that lacked building footprint data.
- Following statistical methods described in Chakraborty et al. (2020), the study also used PCA post-estimation tests such as the Kaiser-Meyer-Olkin (KMO) measure of sampling adequacy (Kaiser, 1974; Krishnan, 2010), Bartlett’s Test of Sphericity (Bartlett, 1954), and Cronbach’s alpha (α) coefficient (Cronbach, 1951) to examine multicollinearity problems, validity, and reliability of the dataset.